Benchmark information
editBenchmark information
editThe following sections provide information about how ELSER performs on different hardwares and compares the model performance to Elasticsearch BM25 and other strong baselines.
Version overview
editELSER V2 has a optimized version that is designed to run only on Linux with an x86-64 CPU architecture and a cross-platform version that can be run on any platform.
ELSER V2
editBesides the performance improvements, the biggest change in ELSER V2 is the introduction of the first platform specific ELSER model - that is, a model optimized to run only on Linux with an x86-64 CPU architecture. The optimized model is designed to work best on newer Intel CPUs, but it works on AMD CPUs as well. It is recommended to use the new optimized Linux-x86-64 model for all new users of ELSER as it is significantly faster than the cross-platform model which can be run on any platform. ELSER V2 produces significantly higher quality embeddings than ELSER V1. Regardless of which ELSER V2 model you use (optimized or cross-platform), the particular embeddings produced are the same.
Qualitative benchmarks
editThe metric that is used to evaluate ELSER’s ranking ability is the Normalized Discounted Cumulative Gain (NDCG) which can handle multiple relevant documents and fine-grained document ratings. The metric is applied to a fixed-sized list of retrieved documents which, in this case, is the top 10 documents (NDCG@10).
The table below shows the performance of ELSER V2 compared to BM 25. ELSER V2 has 10 wins, 1 draw, 1 loss and an average improvement in NDCG@10 of 18%.

NDCG@10 for BEIR data sets for BM25 and ELSER V2 - higher values are better)
Hardware benchmarks
editWhile the goal is to create a model that is as performant as possible, retrieval accuracy always take precedence over speed, this is one of the design principles of ELSER. Consult with the tables below to learn more about the expected model performance. The values refer to operations performed on two data sets and different hardware configurations. Your data set has an impact on the model performance. Run tests on your own data to have a more realistic view on the model performance for your use case.
ELSER V2
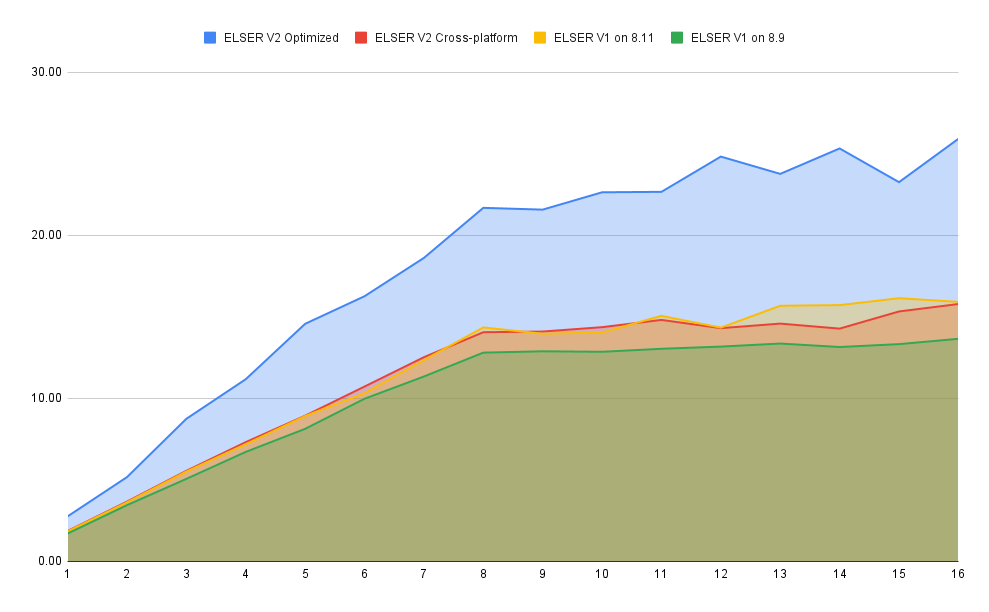
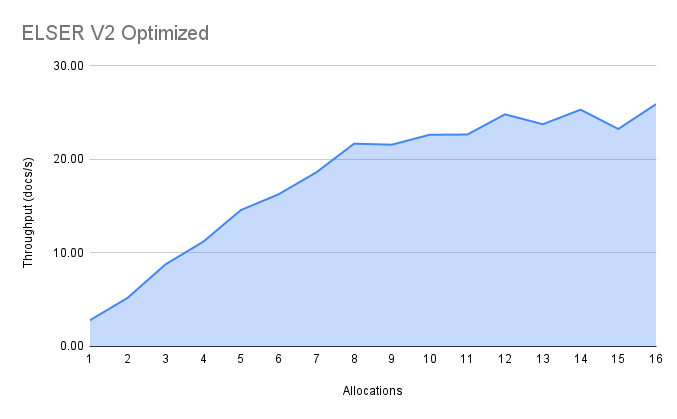
editOverall the optimized V2 model ingested at a max rate of 26 docs/s, compared with the ELSER V1 max rate of 14 docs/s from the ELSER V1 benchamrk, resulting in a 90% increase in throughput.
The performance of virtual cores (that is, when the number of allocations is greater than half of the vCPUs) has increased. Previously, the increase in performance between 8 and 16 allocations was around 7%. It has increased to 17% (ELSER V1 on 8.11) and 20% (for ELSER V2 optimized). These tests were performed on a 16vCPU machine, with all documents containing exactly 256 tokens.
The length of the documents in your particular dataset will have a significant impact on your throughput numbers.
Refer to this blog post to learn more about ELSER V2 improved performance.

The optimized model results show a nearly linear growth up until 8 allocations, after which performance improvements become smaller. In this case, the performance at 8 allocations was 22 docs/s, while the performance of 16 allocations was 26 docs/s, indicating a 20% performance increase due to virtual cores.

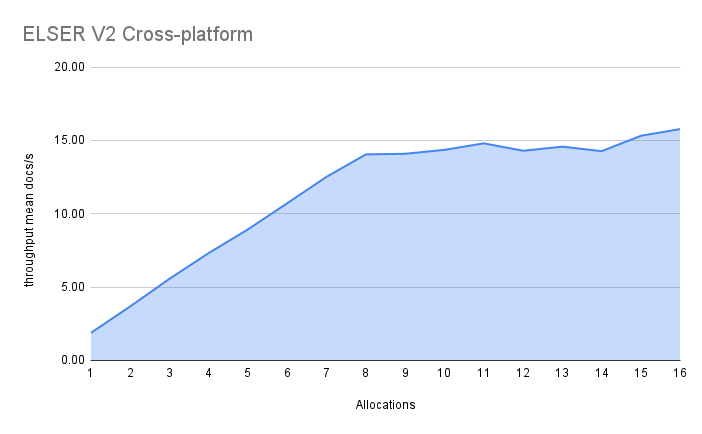
The cross-platform model performance of 8 and 16 allocations are respectively 14 docs/s and 16 docs/s, indicating a performance improvement due to virtual cores of 12%.
