Reporting and sharing
editReporting and sharing
editKibana provides you with several options to share Discover saved searches, dashboards, Visualize Library visualizations, and Canvas workpads.
You access the options from the Share menu in the toolbar. The sharing options include the following:
- PDF Reports — Generate and download a PDF file of a dashboard, visualization, or Canvas workpad. PDF reports are a subscription feature.
- PNG Reports — Generate and download a PNG file of a dashboard or visualization. PNG reports are a subscription feature.
- CSV Reports — Generate and download CSV files of saved searches. Certain limitations apply.
- CSV Reports — Generate and download a CSV file of a Discover saved search.
- Permalinks — Share a direct link to a Discover saved search, dashboard, or visualization.
- Download as JSON — Generate and download a JSON file of a Canvas workpad.
- [beta] This functionality is in beta and is subject to change. The design and code is less mature than official GA features and is being provided as-is with no warranties. Beta features are not subject to the support SLA of official GA features. Share on a website — Download and securely share Canvas workpads on any website.
- Embed code — Embed a fully interactive dashboard or visualization as an iframe on a web page.
Create reports
editCreate and download PDF, PNG, or CSV reports of saved searches, dashboards, visualizations, and workpads.
The layout and size of the report depends on what you are sharing. For saved searches, dashboards, and visualizations, the layout depends on the size of the panels. For workpads, the layout depends on the size of the worksheet dimensions.
To change the output size, change the size of the browser, which resizes the shareable container before the report generates. It might take some trial and error before you’re satisfied.
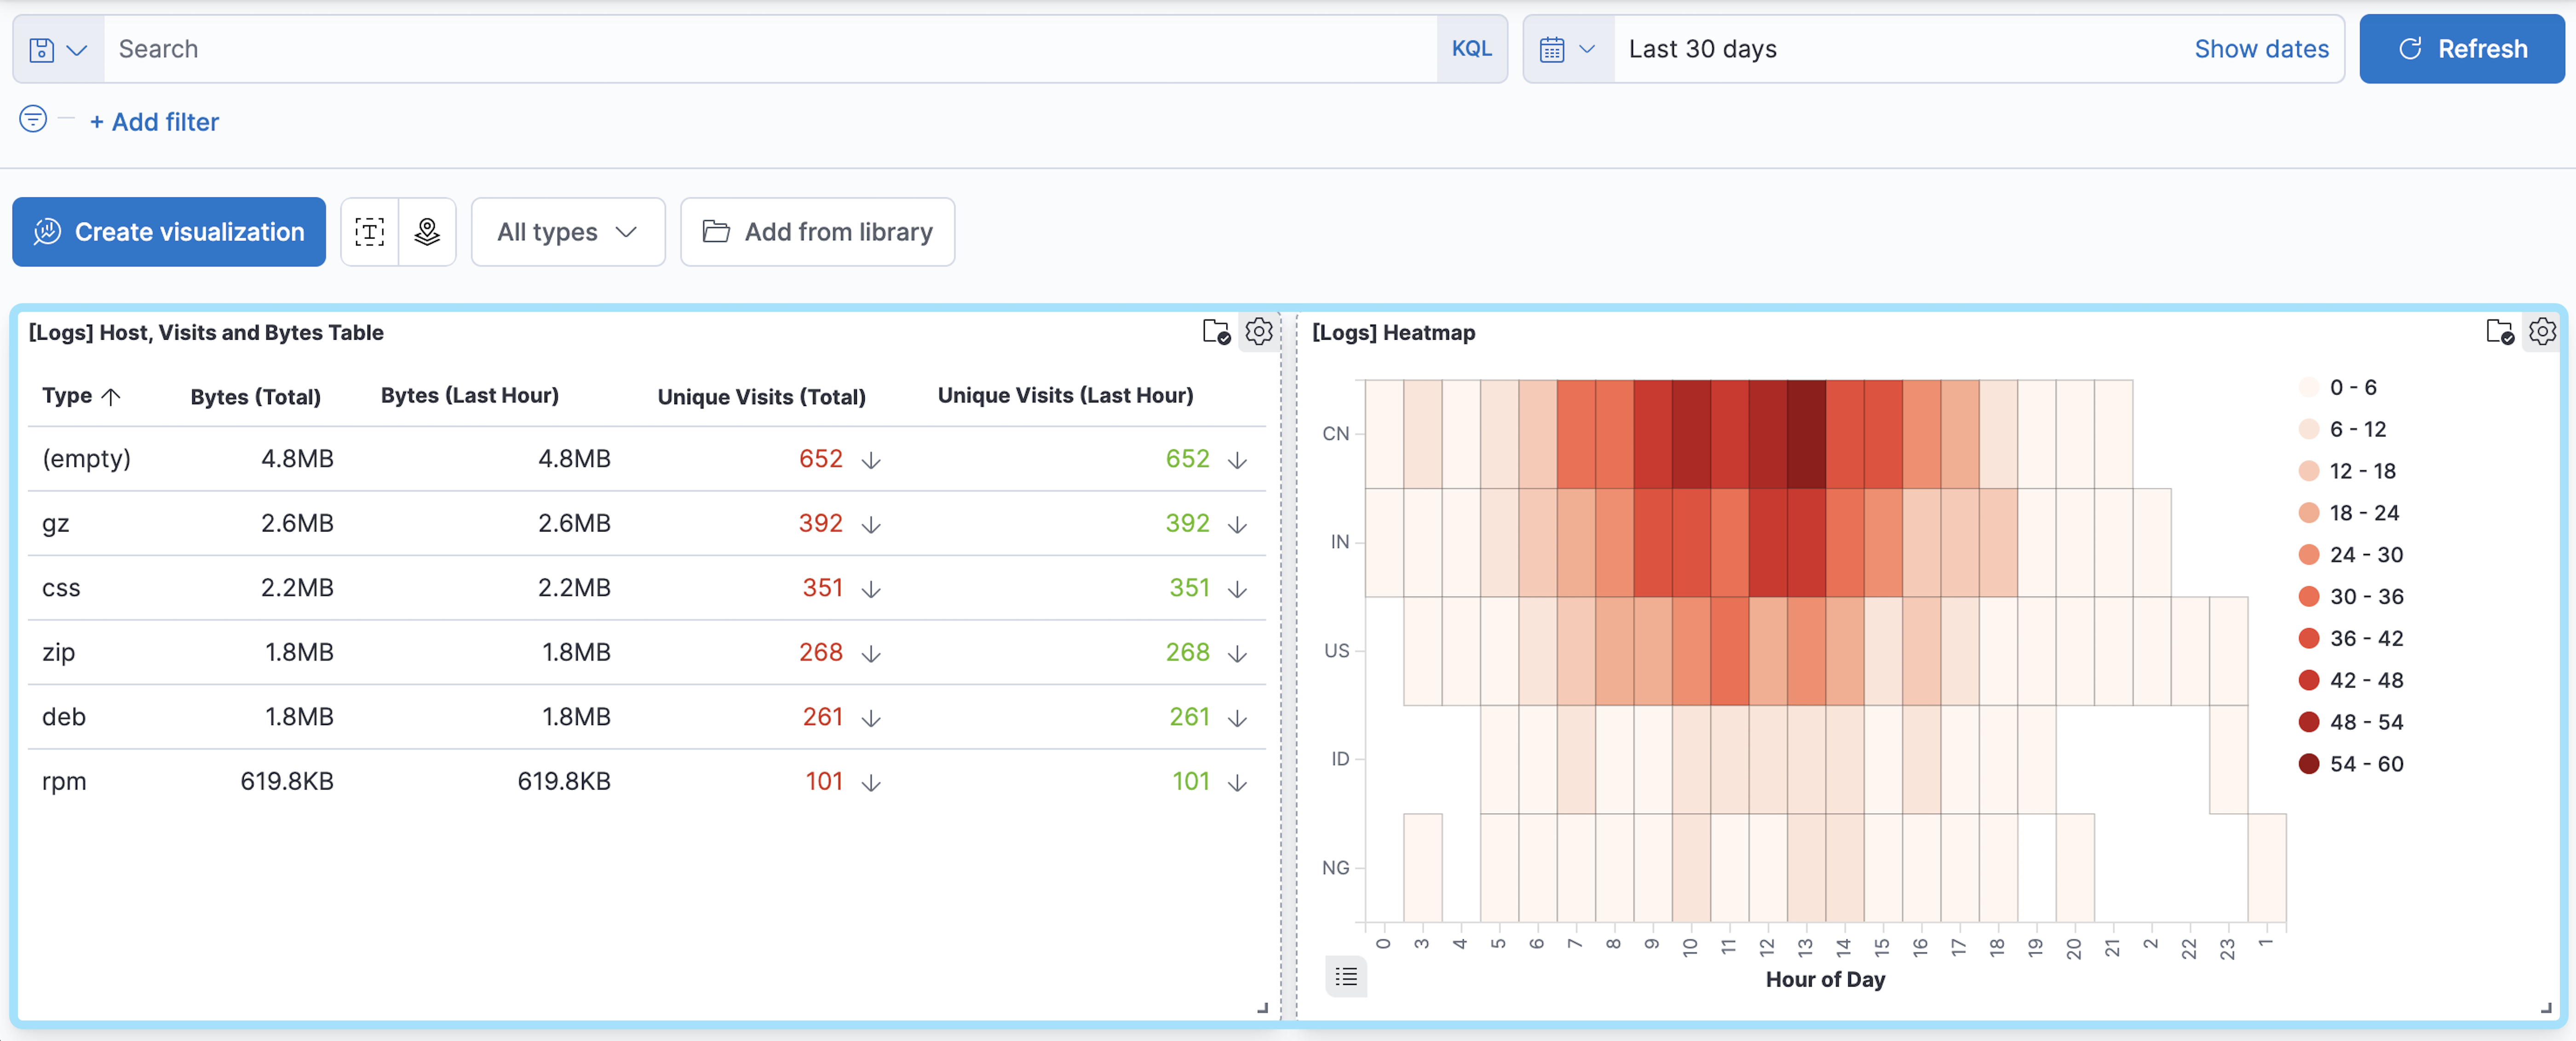
In the following dashboard, the shareable container is highlighted:

- Open the main menu, then open the saved search, dashboard, visualization, or workpad you want to share.
-
From the toolbar, click Share, then select one of the following options:
- PDF Reports — Generates a PDF file of the dashboard, visualization, or workpad.
- PNG Reports — Generates a PNG file of the dashboard or visualization.
- CSV Reports — Generates a CSV report of the saved search.
-
If you are creating a PDF report of a dashboard, select Optimize for printing to create a printer-friendly PDF with multiple A4 portrait pages and two visualizations per page.
When you create a dashboard report that includes a data table or saved search, the PDF includes only the visible data.
- If you are creating a PDF report of a workpad, select Full page layout to create a PDF without margins that surround the workpad.
- Generate the report.
- When the report generates, a message appears. On the message, click Download report.
- To view and manage reports, open the main menu, then click Stack Management > Reporting.
Reports are stored in Elasticsearch and managed by the kibana-reporting index lifecycle management
(ILM) policy. By default, the policy stores reports forever. To learn
more about ILM policies, refer to the Elasticsearch
ILM documentation.
CSV reports limitations
editWe recommend using CSV reports to export moderate amounts of data only. The feature enables analysis of data in external tools, but it is not intended for bulk export or to backup Elasticsearch data. Report timeout and incomplete data issues are likely if you are exporting data where:
- More than 250 MB of data is being exported
- Data is stored on slow storage tiers
- Any shard needed for the search is unavailable
- Network latency between nodes is high
- Cross-cluster search is used
To work around the limitations, use filters to create multiple smaller reports, or extract the data you need directly with the Elasticsearch APIs. See Scroll API, Point in time API, or SQL with CSV response data format. Reporting parameters can be adjusted to overcome some of these limiting scenarios. Results are dependent on data size, availability, and latency factors and are not guaranteed.
Share a direct link
editShare a direct link to a saved search, dashboard, or visualization. To access the shared object, authentication is required.
- Open the main menu, then open the saved search, dashboard, or visualization you want to share.
- From the toolbar, click Share, then select Permalinks.
-
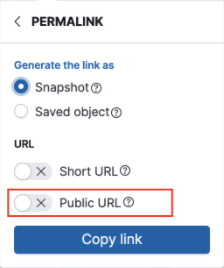
Specify how you want to generate the link:
- To display only the current state of the object, select Snapshot.
- To display up-to-date changes, select Saved object.
- To generate a shortened link, select Short URL.
-
To automatically log in anonymous users when you have multiple authentication providers enabled, select Public URL.

Public URL is available only when anonymous access is configured and your anonymous service account has privileges to access what you want to share. For more information, refer to Anonymous authentication.
- Click Copy link.
Create a JSON file
editCreate a JSON file for a workpad.
- Open the main menu, then click Canvas.
- Open the workpad you want to share.
- From the toolbar, click Share, then select Download as JSON.
Share workpads on a website
edit[beta] This functionality is in beta and is subject to change. The design and code is less mature than official GA features and is being provided as-is with no warranties. Beta features are not subject to the support SLA of official GA features. Canvas allows you to create shareables, which are workpads that you download and securely share on a website. To customize the behavior of the workpad on your website, you can choose to autoplay the pages or hide the workpad toolbar.
- Open the main menu, then click Canvas.
- Open the workpad you want to share.
- Click Share > Share on a website.
- Follow the instructions.
-
To customize the workpad behavior to autoplay the pages or hide the toolbar, use the inline parameters.
To make sure that your data remains secure, the data in the JSON file is not connected to Kibana. Canvas does not display elements that manipulate the data on the workpad.
Shareable workpads encode the current state of the workpad in a JSON file. When you make changes to the workpad, the changes do not appear in the shareable workpad on your website.
- To change the settings, click the settings icon, then choose the settings you want to use.
Embed code
editDisplay your dashboard or visualization on an internal company website or personal web page with an iframe. Embedding other Kibana objects is generally supported, but you might need to manually craft the proper HTML code.
Some users might not have access to the dashboard or visualization. For more information, refer to Anonymous access and embedding and Embedded content authentication.
- Open the main menu, then open the dashboard or visualization you want to share.
- Click Share > Embed code.
-
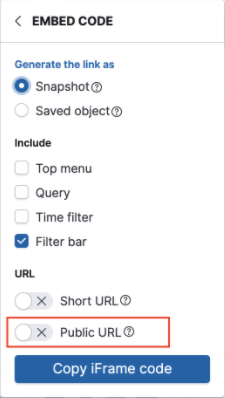
Specify how you want to generate the code:
- To display only the current state, select Snapshot.
- To display up-to-date changes, select Saved object.
- Select the dashboard or visualization elements you want to include.
- To generate a shortened link, select Short URL.
-
To automatically log in anonymous users when you have multiple authentication providers enabled, select Public URL.

Public URL is available only when anonymous access is configured and your anonymous service account has privileges to access what you want to embed. For more information, refer to Anonymous authentication.
- Click Copy iFrame code.