Using ES|QL in Kibana
editUsing ES|QL in Kibana
editYou can use ES|QL in Kibana to query and aggregate your data, create visualizations, and set up alerts.
This guide shows you how to use ES|QL in Kibana. To follow along with the queries, load the "Sample web logs" sample data set by selecting Sample Data from the Integrations page in Kibana, selecting Other sample data sets, and clicking Add data on the Sample web logs card.
Enable or disable ES|QL
editES|QL is enabled by default in Kibana. It can be
disabled using the enableESQL setting from the
Advanced Settings.
This will hide the ES|QL user interface from various applications. However, users will be able to access existing ES|QL artifacts like saved searches and visualizations.
Get started with ES|QL
editTo get started with ES|QL in Discover, open the main menu and select Discover. Next, select Try ES|QL from the application menu bar.
The query bar
editAfter switching to ES|QL mode, the query bar shows a sample query. For example:
from kibana_sample_data_logs | limit 10
Every query starts with a source command. In this query, the
source command is FROM. FROM retrieves data from data streams, indices, or
aliases. In this example, the data is retrieved from kibana_sample_data_logs.
A source command can be followed by one or more processing
commands. In this query, the processing command is LIMIT. LIMIT
limits the number of rows that are retrieved.
Click the ES|QL help button to open the in-product reference documentation for all commands and functions or to get recommended queries that will help you get started.
To make it easier to write queries, auto-complete offers suggestions with possible commands and functions:

ES|QL keywords are case-insensitive. The following query is identical to the previous one:
FROM kibana_sample_data_logs
| LIMIT 10
Make your query readable
editFor readability, you can put each processing command on a new line. The following query is identical to the previous one:
FROM kibana_sample_data_logs | LIMIT 10
You can do that using the Add line breaks on pipes button from the query editor’s footer.
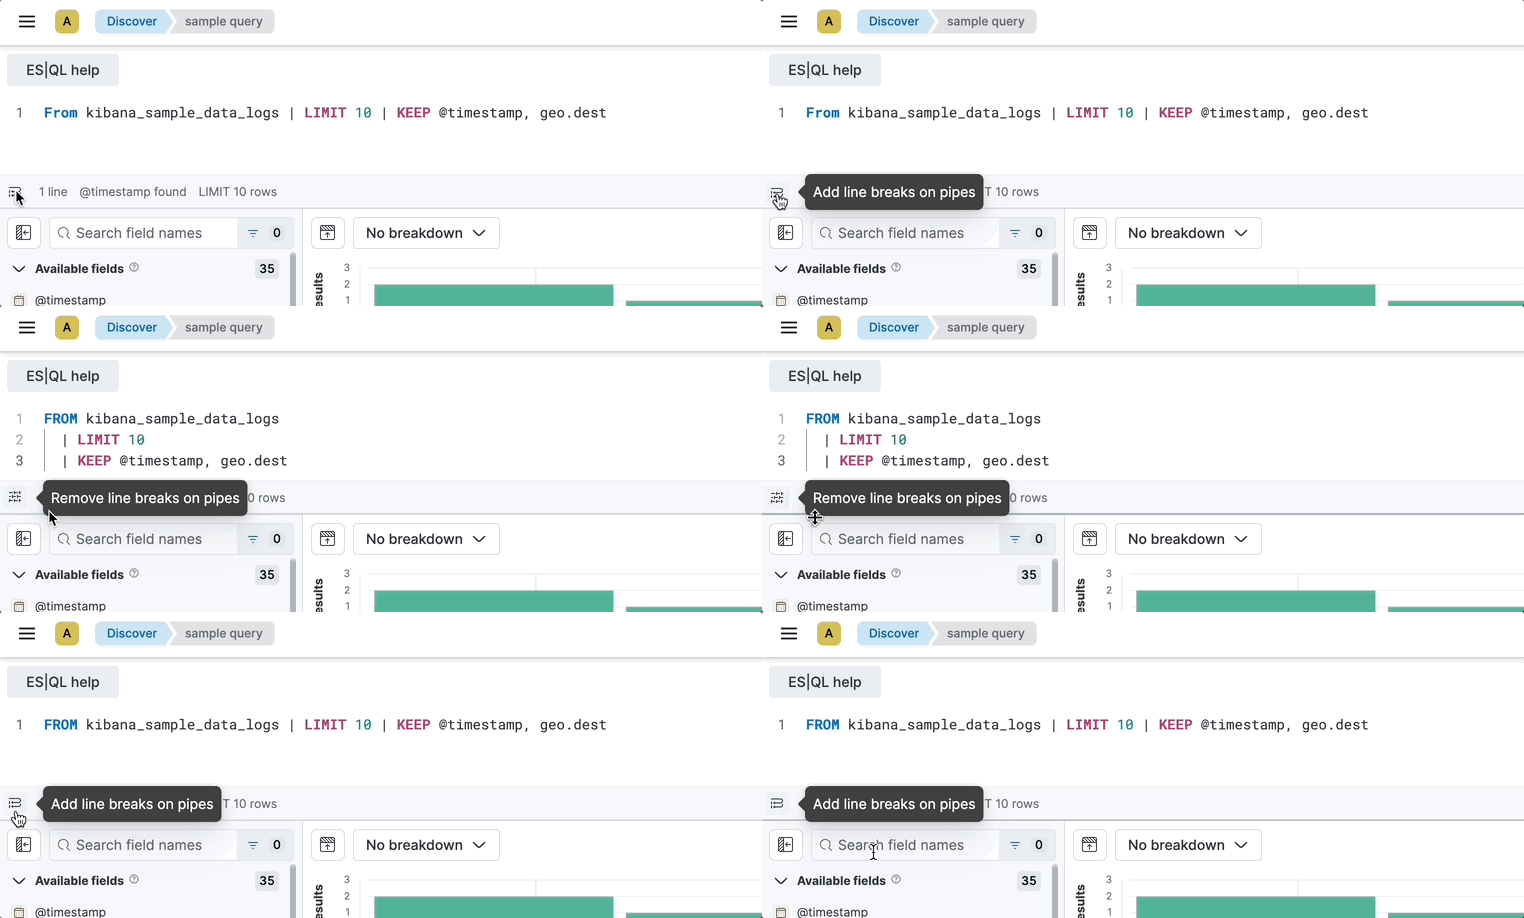
You can adjust the editor’s height by dragging its bottom border to your liking.
Warnings
editA query may result in warnings, for example when querying an unsupported field type. When that happens, a warning symbol is shown in the query bar. To see the detailed warning, expand the query bar, and click warnings.
Query history
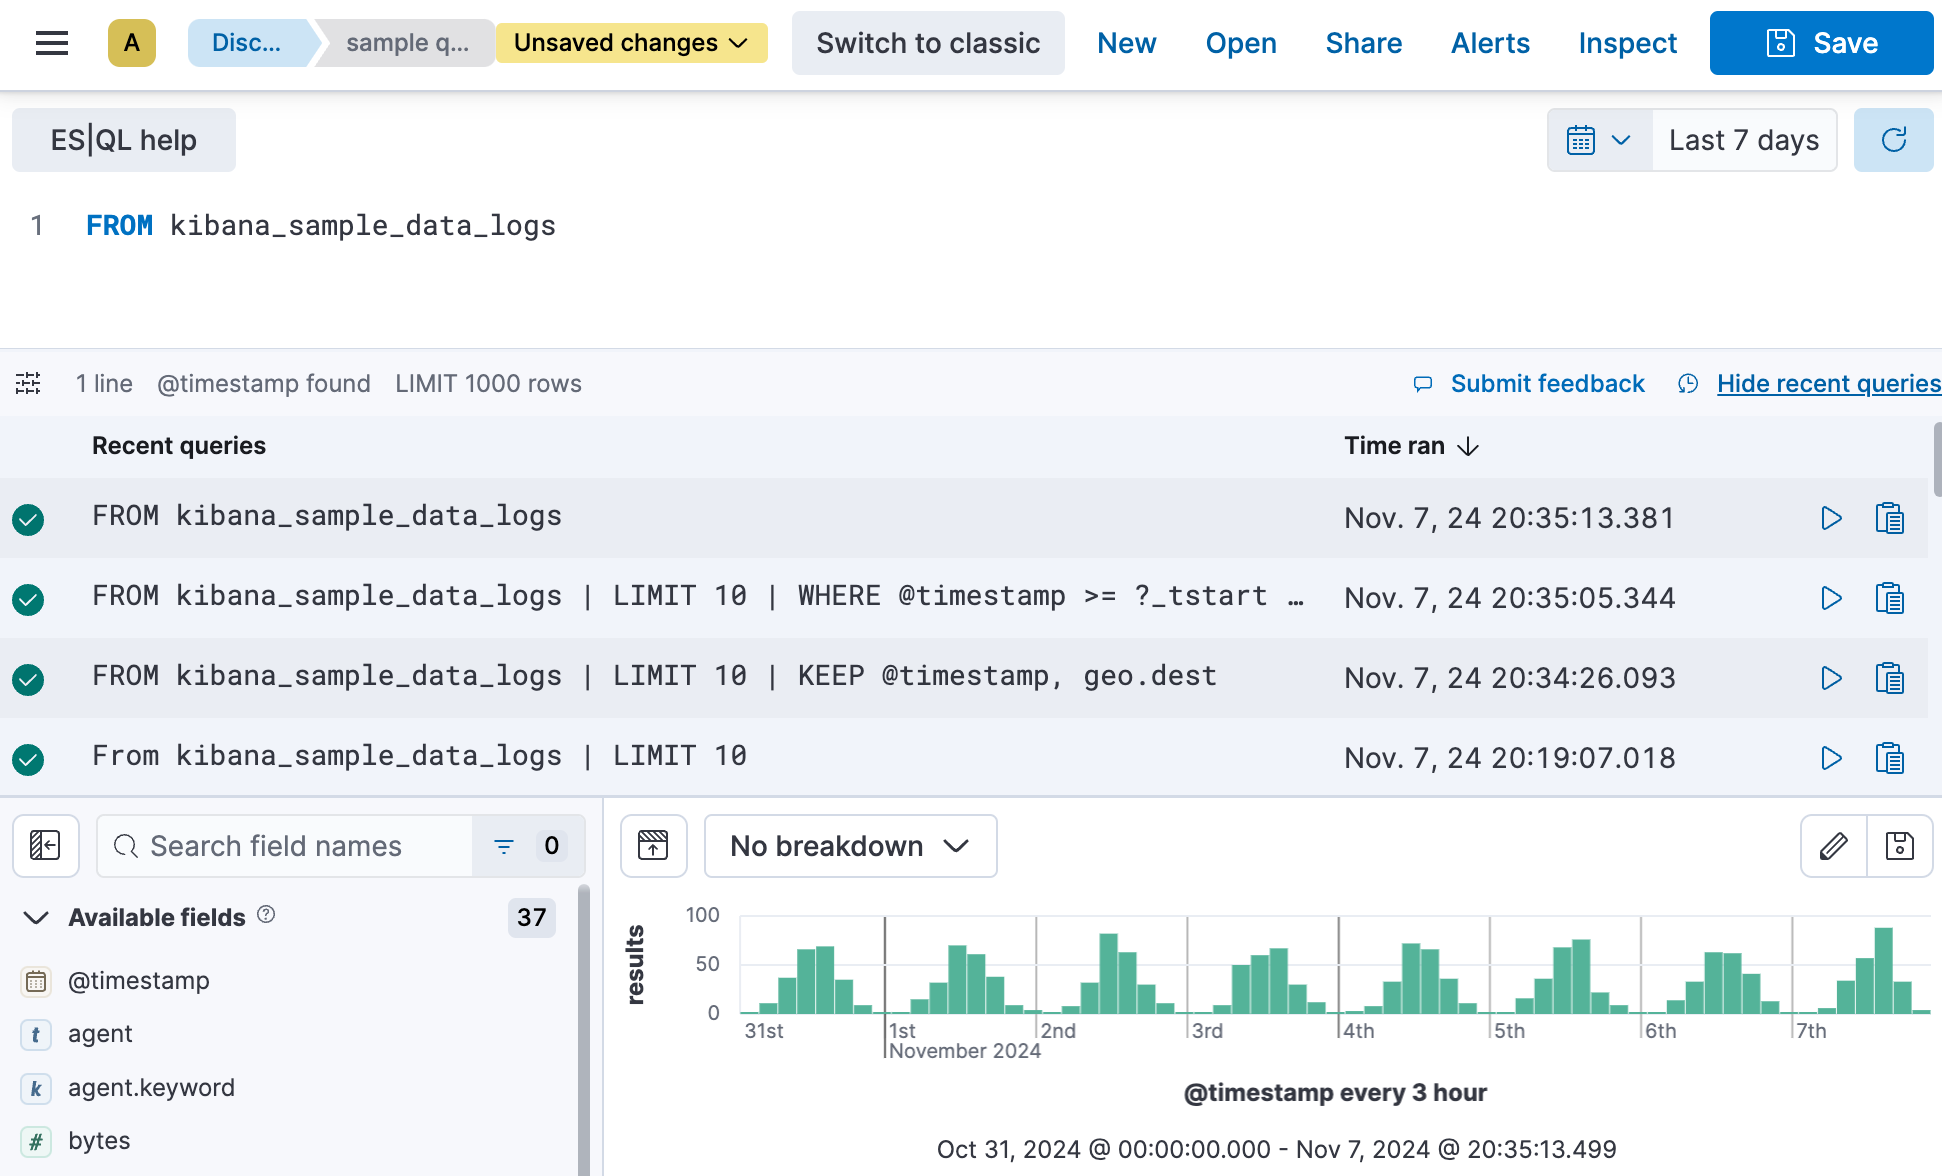
editYou can reuse your recent ES|QL queries in the query bar. In the query bar click Show recent queries.
You can then scroll through your recent queries:
The results table
editFor the example query, the results table shows 10 rows. Omitting the LIMIT
command, the results table defaults to up to 1000 rows. Using LIMIT, you can
increase the limit to up to 10,000 rows.
the 10,000 row limit only applies to the number of rows that are retrieved by the query and displayed in Discover. Any query or aggregation runs on the full data set.
Each row shows two columns for the example query: a column with the @timestamp
field and a column with the full document. To display specific fields from the
documents, use the KEEP command:
FROM kibana_sample_data_logs
| KEEP @timestamp, bytes, geo.dest
To display all fields as separate columns, use KEEP *:
FROM kibana_sample_data_logs
| KEEP *
The maximum number of columns in Discover is 50. If a query returns more than 50 columns, Discover only shows the first 50.
Sorting
editTo sort on one of the columns, click the column name you want to sort on and
select the sort order. Note that this performs client-side sorting. It only
sorts the rows that were retrieved by the query, which may not be the full
dataset because of the (implicit) limit. To sort the full data set, use the
SORT command:
FROM kibana_sample_data_logs
| KEEP @timestamp, bytes, geo.dest
| SORT bytes DESC
Time filtering
editTo display data within a specified time range, you can use the standard time filter, custom time parameters, or a WHERE command.
Standard time filter
editThe standard time filter is enabled
when the indices you’re querying have a field named @timestamp.
Custom time parameters
editIf your indices do not have a field named @timestamp, you can use
the ?_tstart and ?_tend parameters to specify a time range. These parameters
work with any timestamp field and automatically sync with the time filter.
FROM my_index
| WHERE custom_timestamp >= ?_tstart AND custom_timestamp < ?_tend
You can also use the ?_tstart and ?_tend parameters with the BUCKET function
to create auto-incrementing time buckets in ES|QL visualizations.
For example:
FROM kibana_sample_data_logs
| STATS average_bytes = AVG(bytes) BY BUCKET(@timestamp, 50, ?_tstart, ?_tend)
This example uses 50 buckets, which is the maximum number of buckets.
WHERE command
editYou can also limit the time range using the WHERE command and the NOW function.
For example, if the timestamp field is called timestamp, to query the last 15
minutes of data:
FROM kibana_sample_data_logs
| WHERE timestamp > NOW() - 15minutes
Analyze and visualize data
editBetween the query bar and the results table, Discover shows a date histogram
visualization. By default, if the indices you’re querying do not contain a @timestamp
field, the histogram is not shown. But you can use a custom time field with the ?_tstart
and ?_tend parameters to enable it.
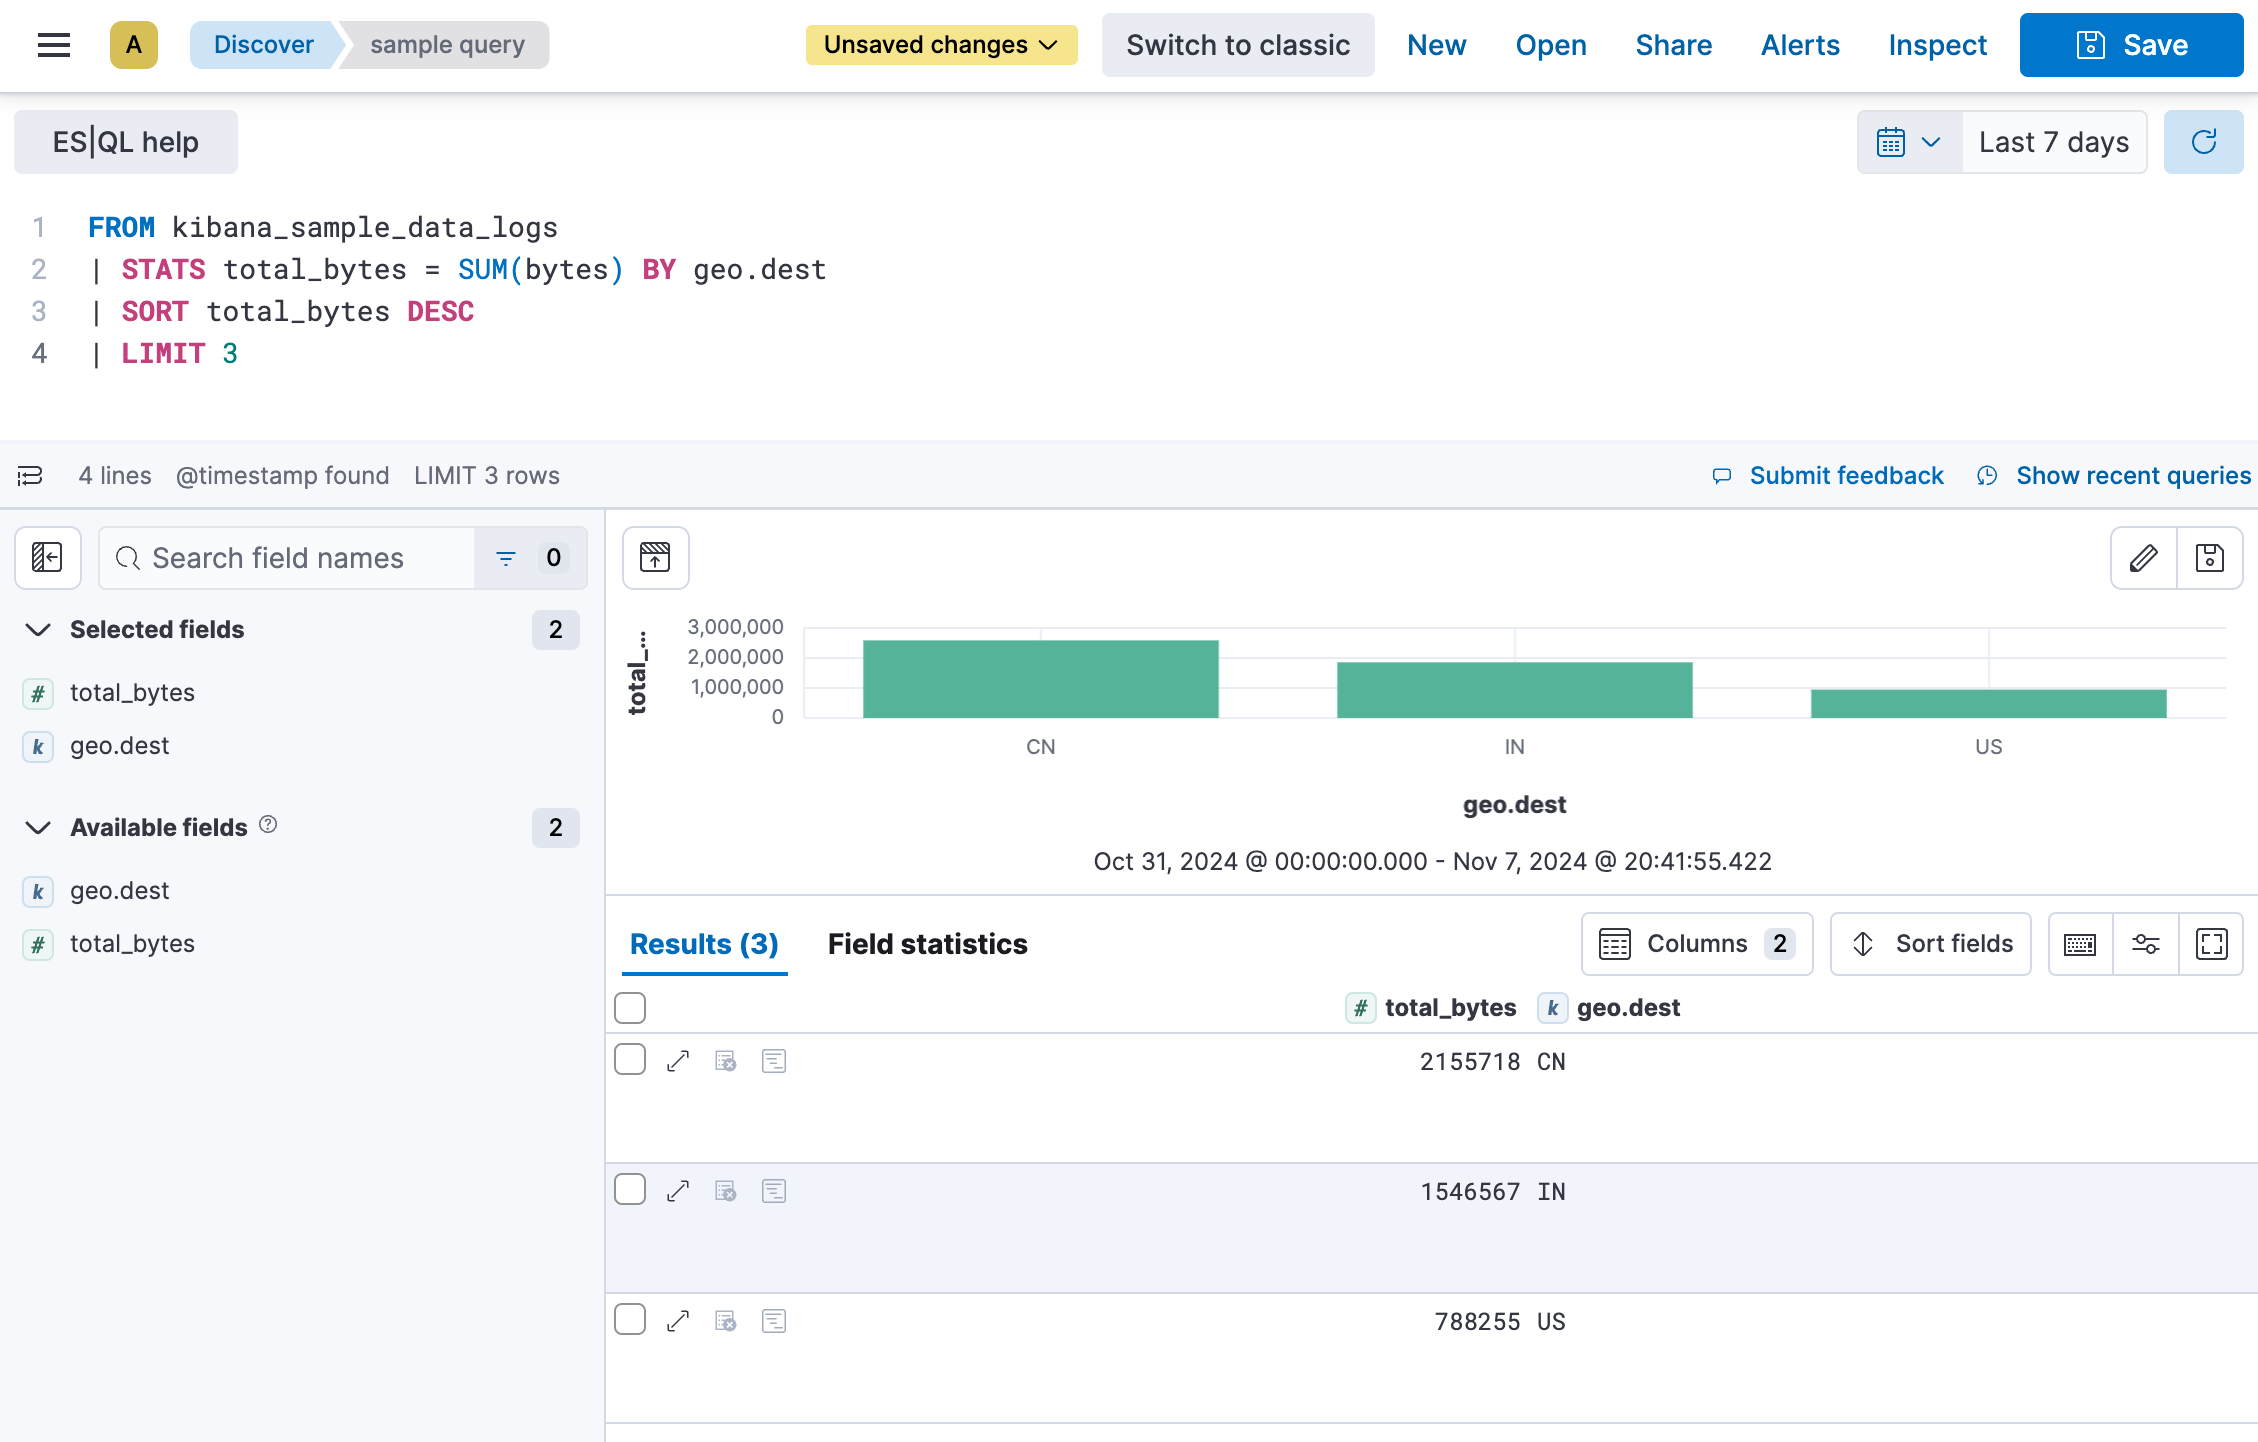
The visualization adapts to the query. A query’s nature determines the type of visualization. For example, this query aggregates the total number of bytes per destination country:
FROM kibana_sample_data_logs
| STATS total_bytes = SUM(bytes) BY geo.dest
| SORT total_bytes DESC
| LIMIT 3
The resulting visualization is a bar chart showing the top 3 countries:
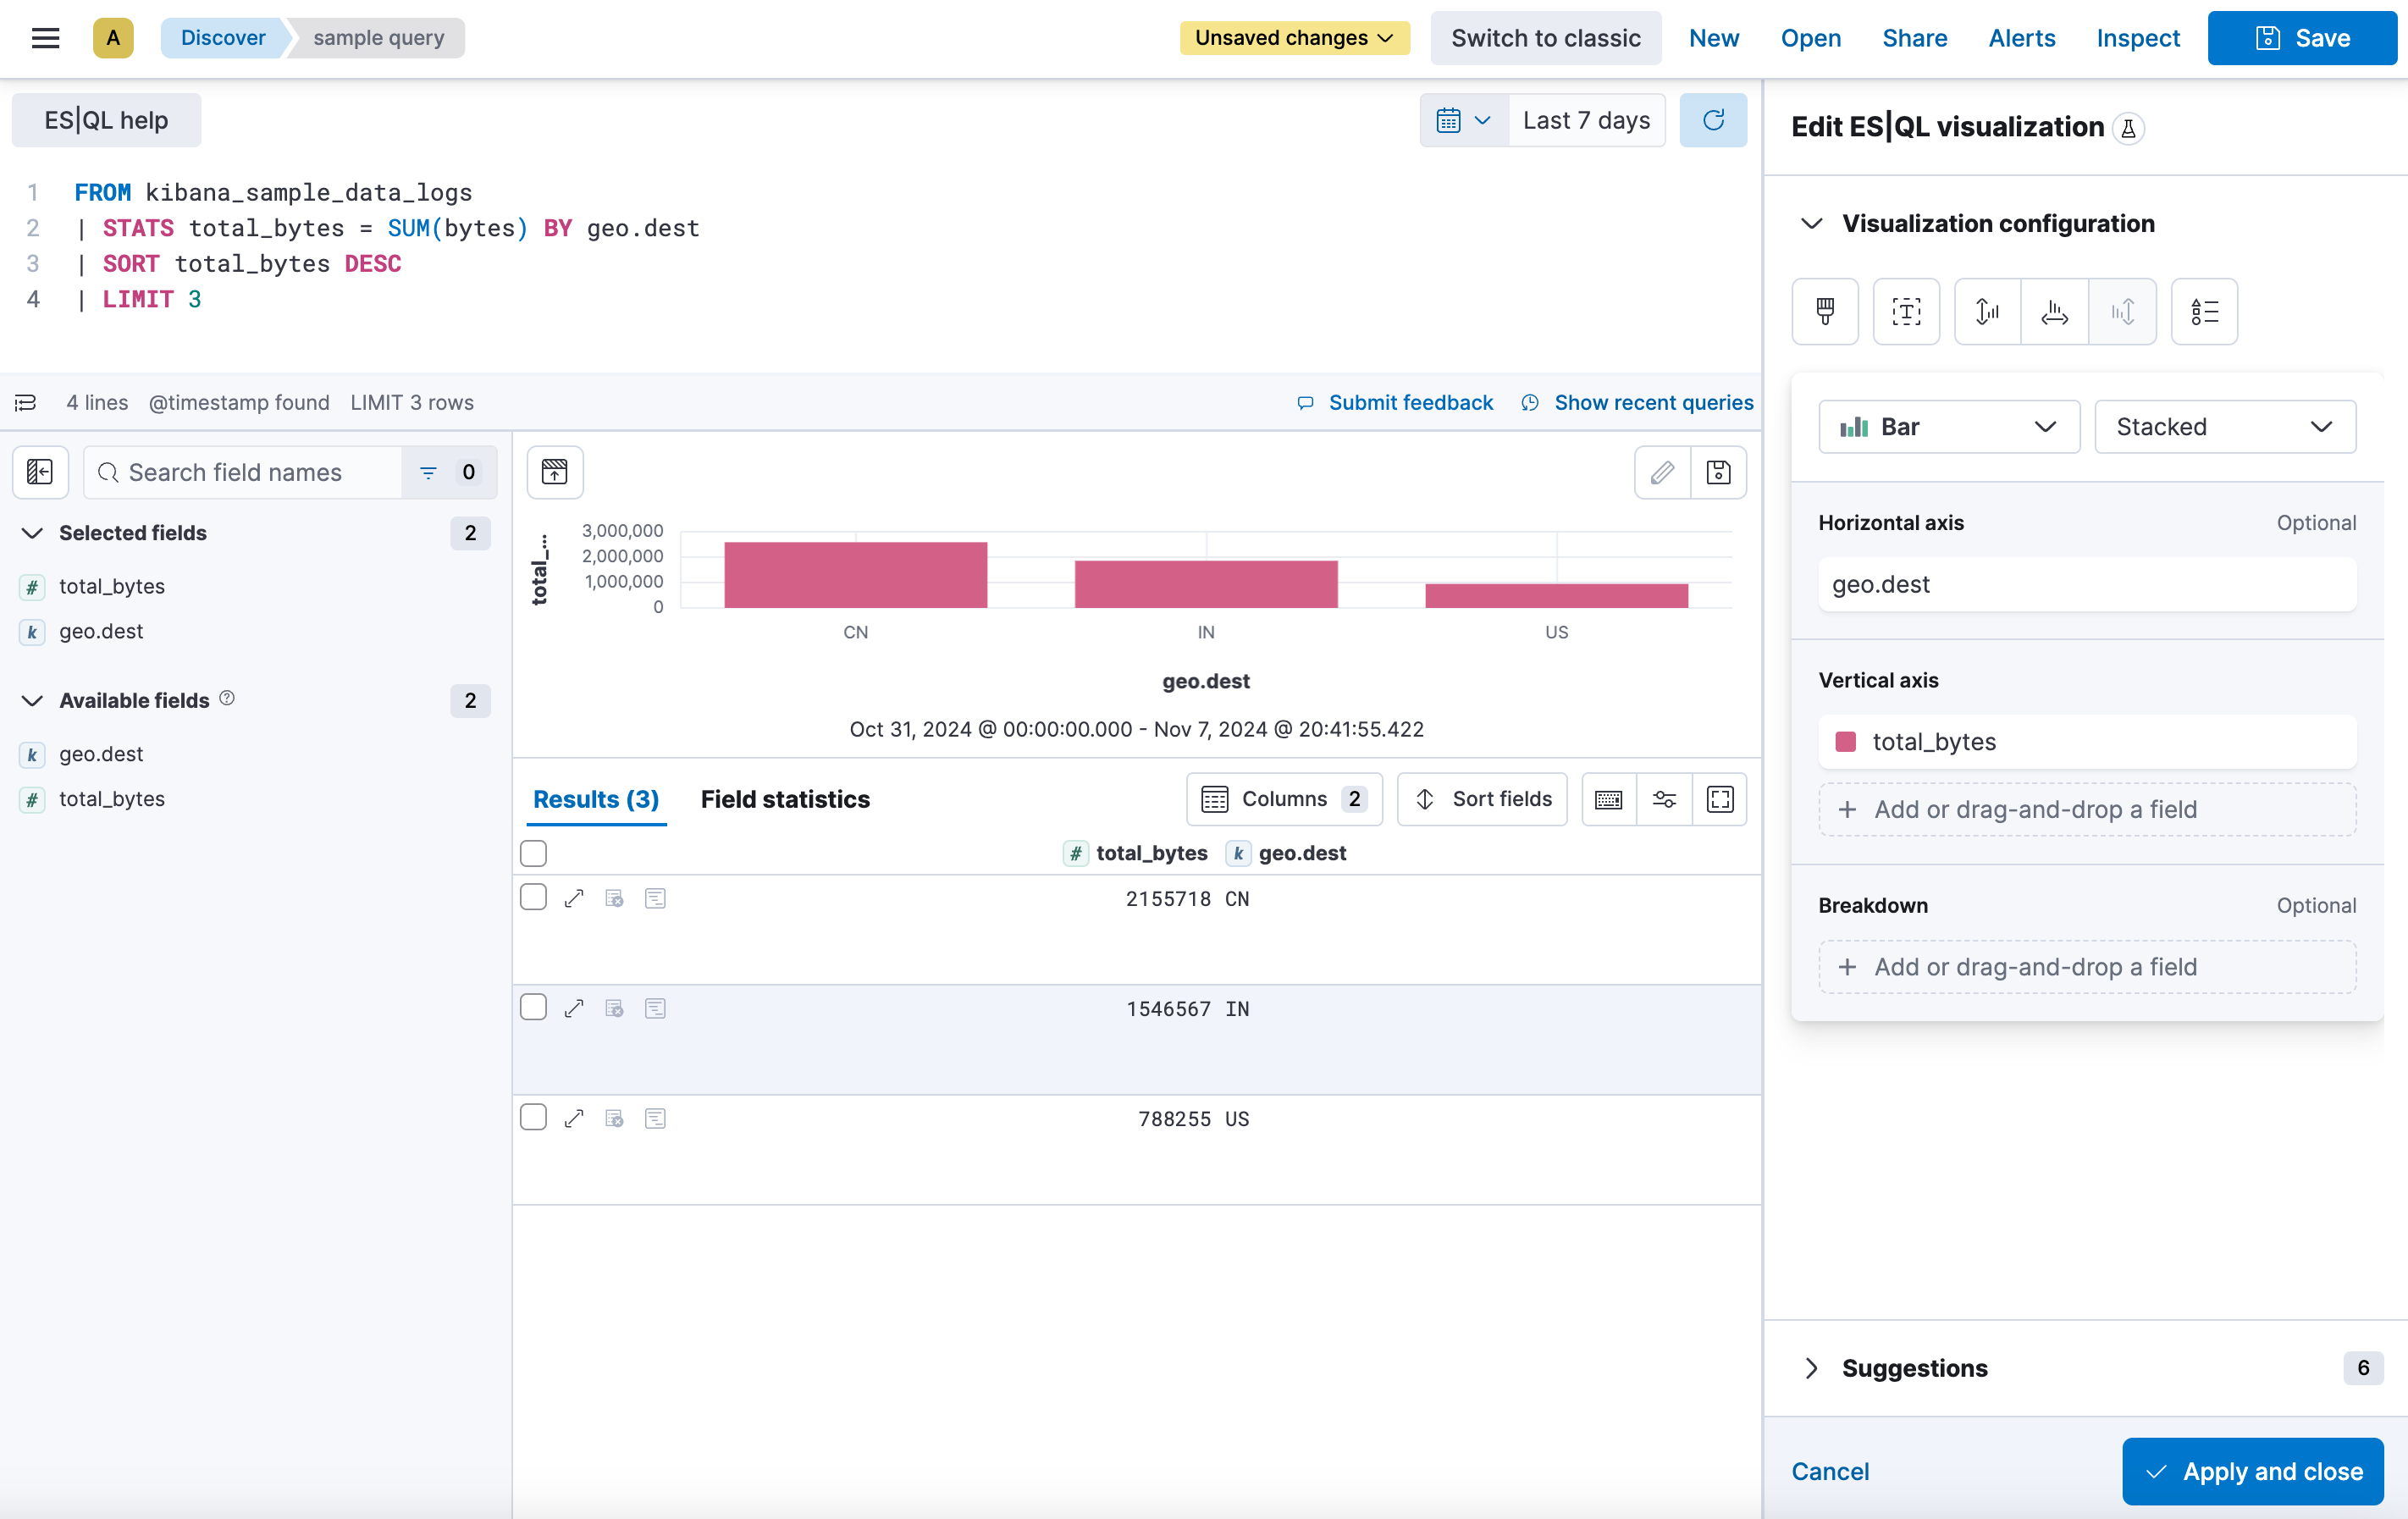
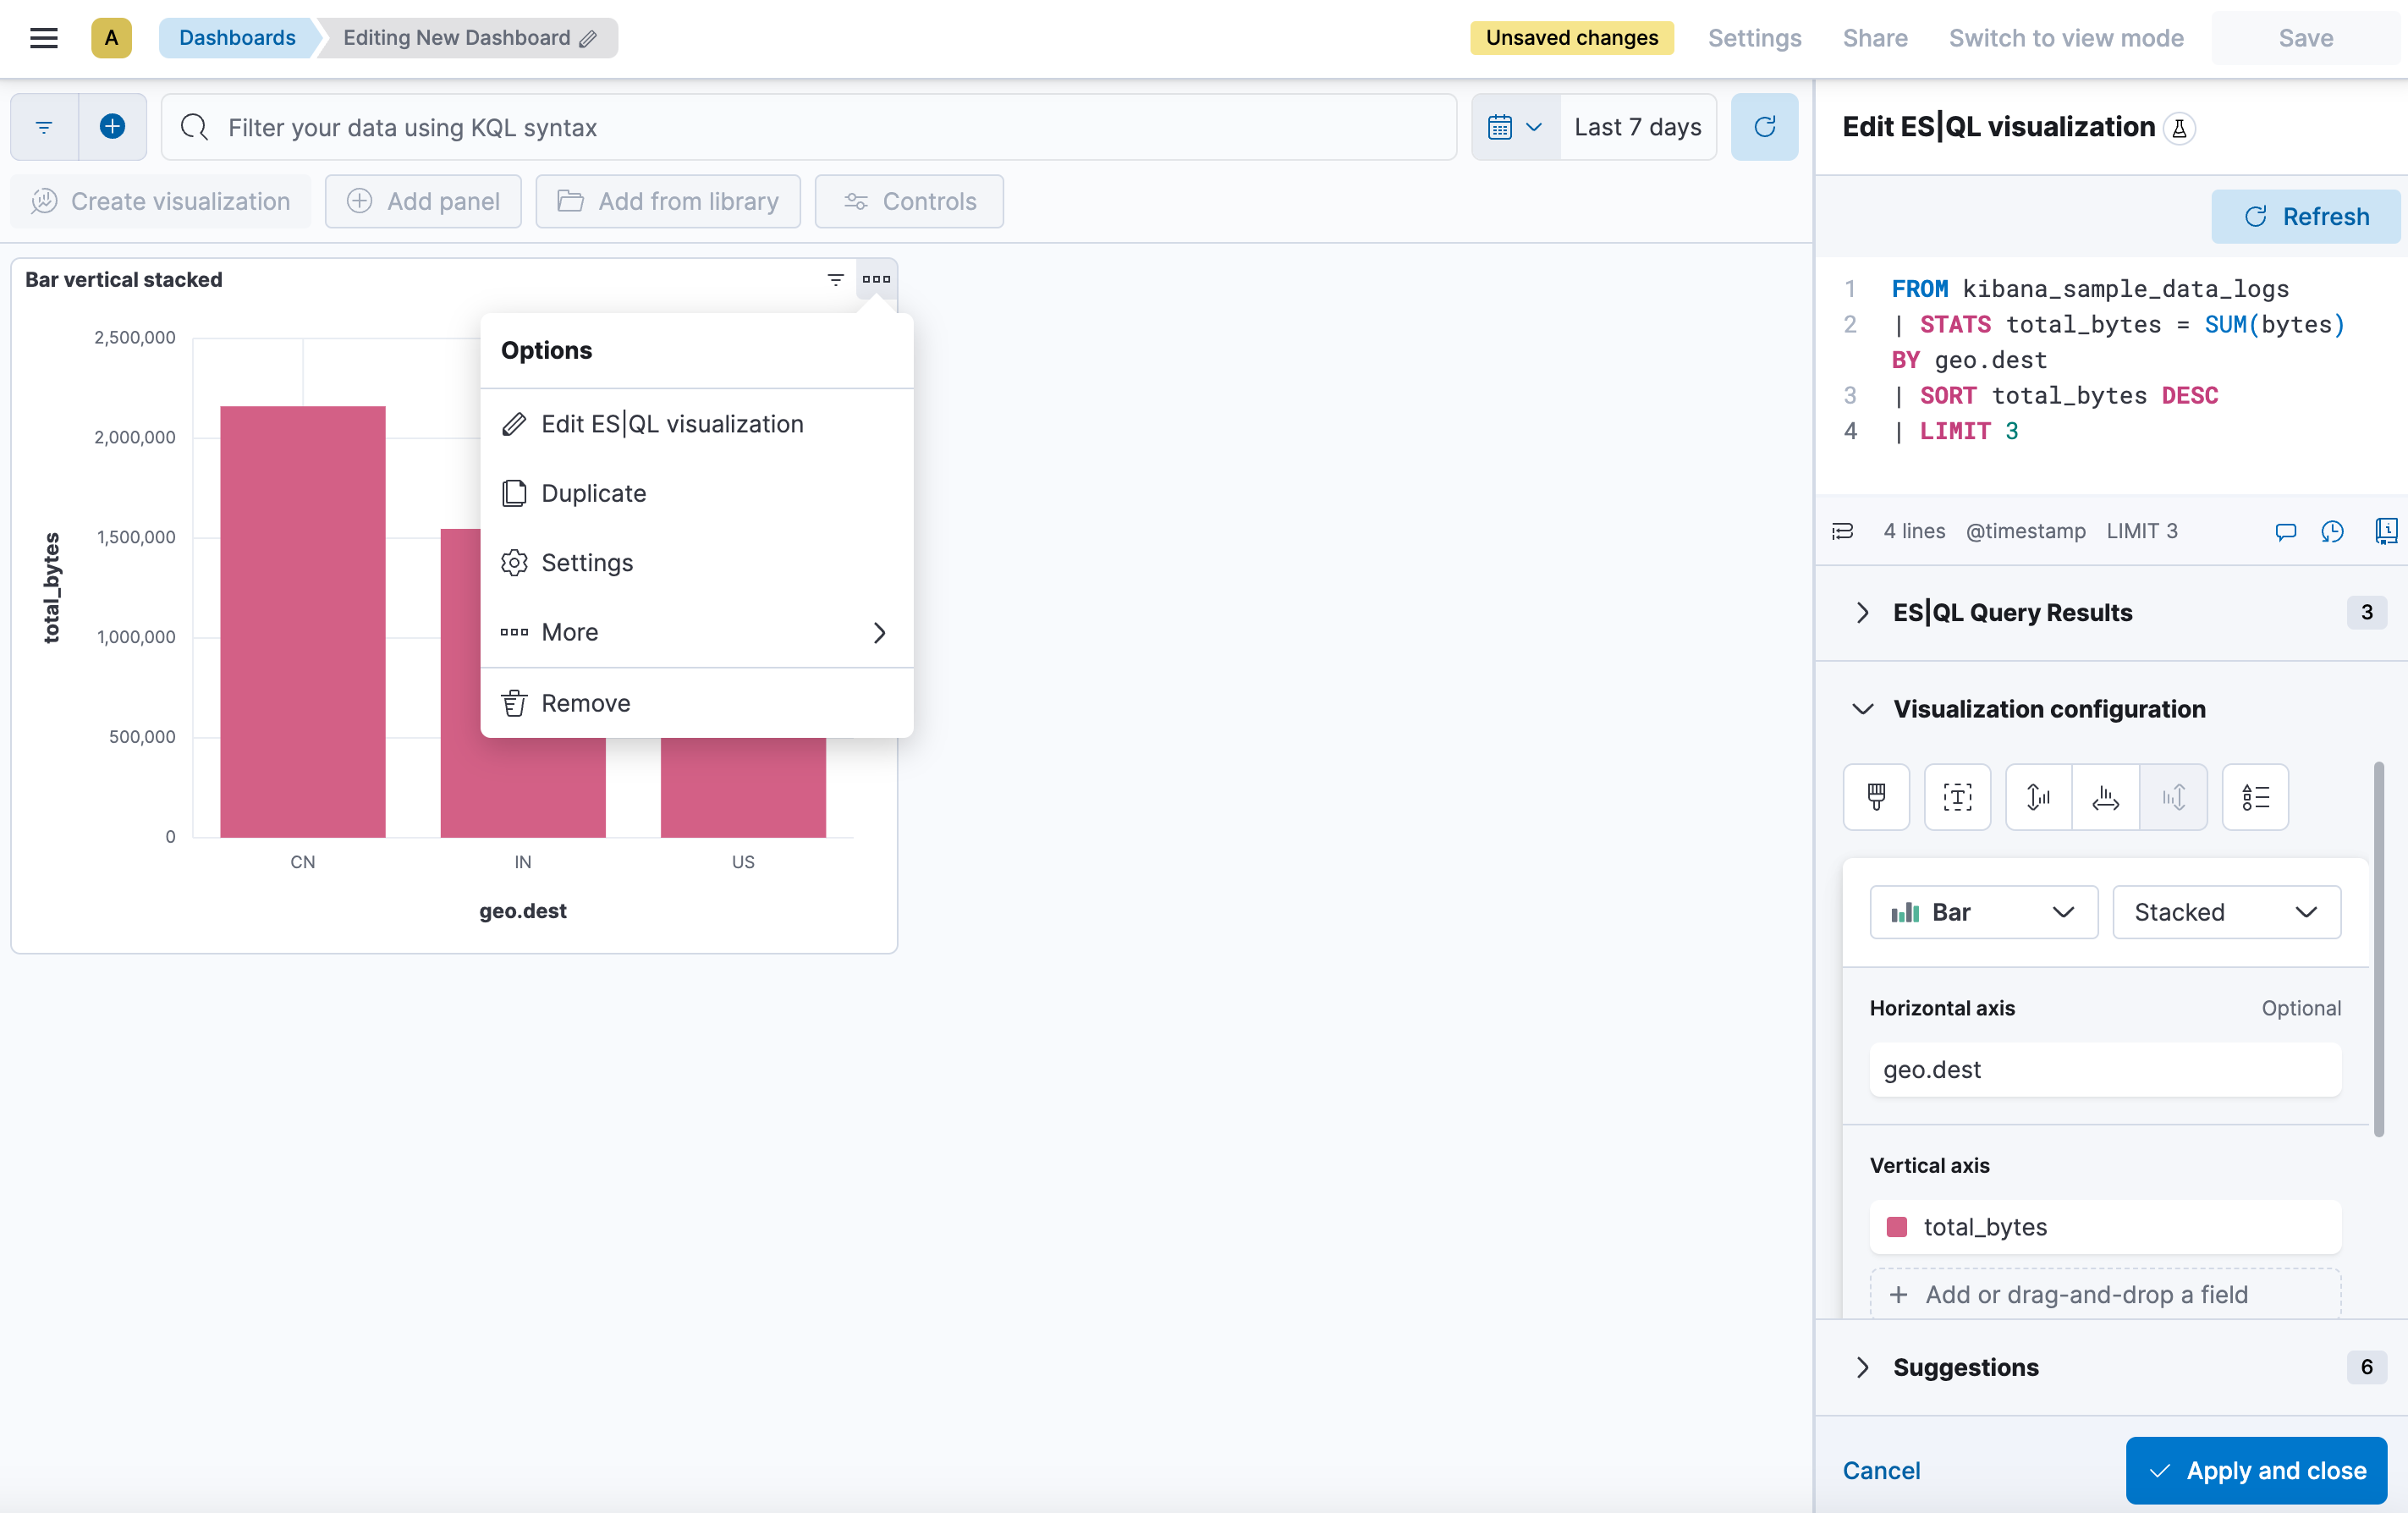
To make changes to the visualization, like changing the visualization type, axes and colors, click the
pencil button (). This opens
an in-line editor:
You can save the visualization to a new or existing dashboard by clicking the
save button (). Once saved
to a dashboard, you’ll be taken to the Dashboards page. You can continue to
make changes to the visualization. Click the
options button in the top-right (
) and
select Edit ES|QL visualization to open the in-line editor:
Add a panel to a dashboard
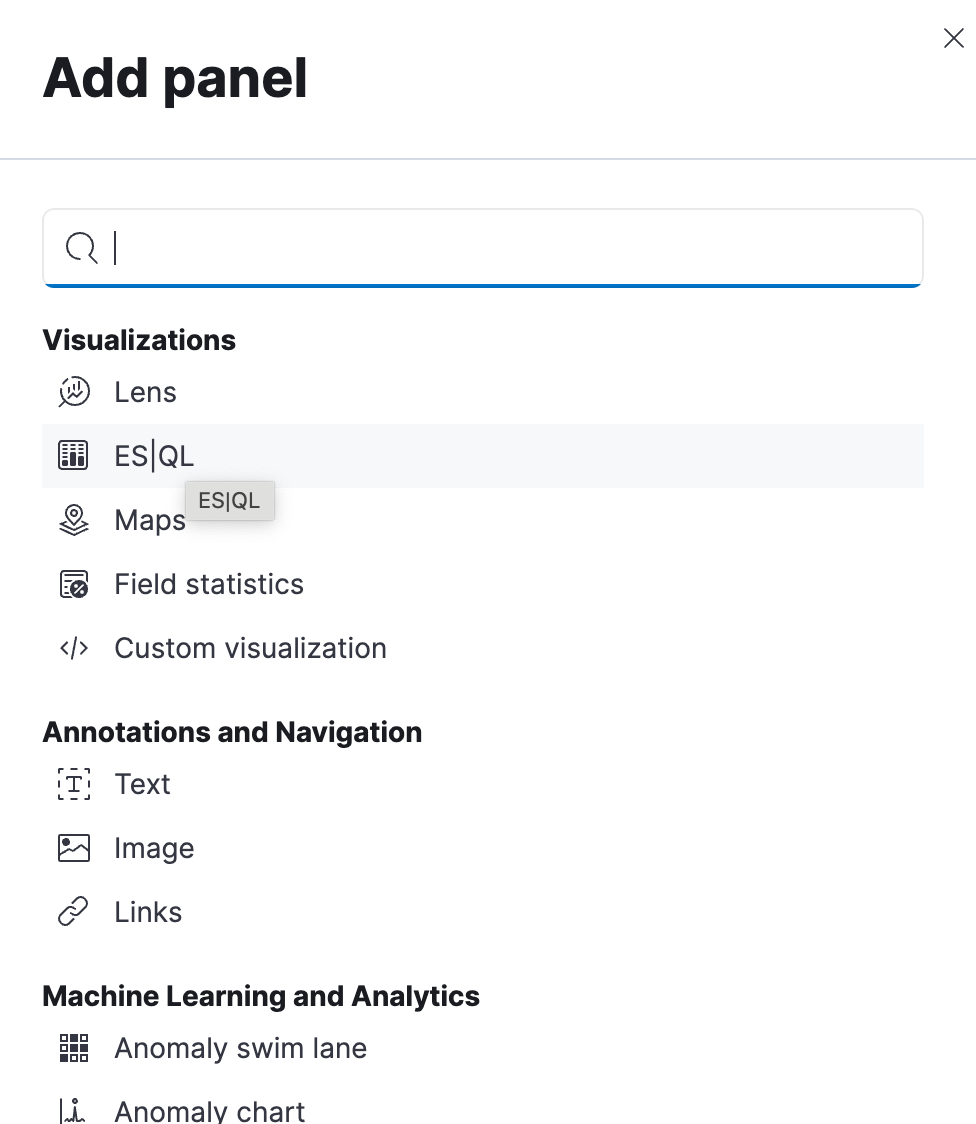
editYou can use ES|QL queries to create panels on your dashboards. To add a panel to a dashboard, under Dashboards, click the Add panel button and select ES|QL.
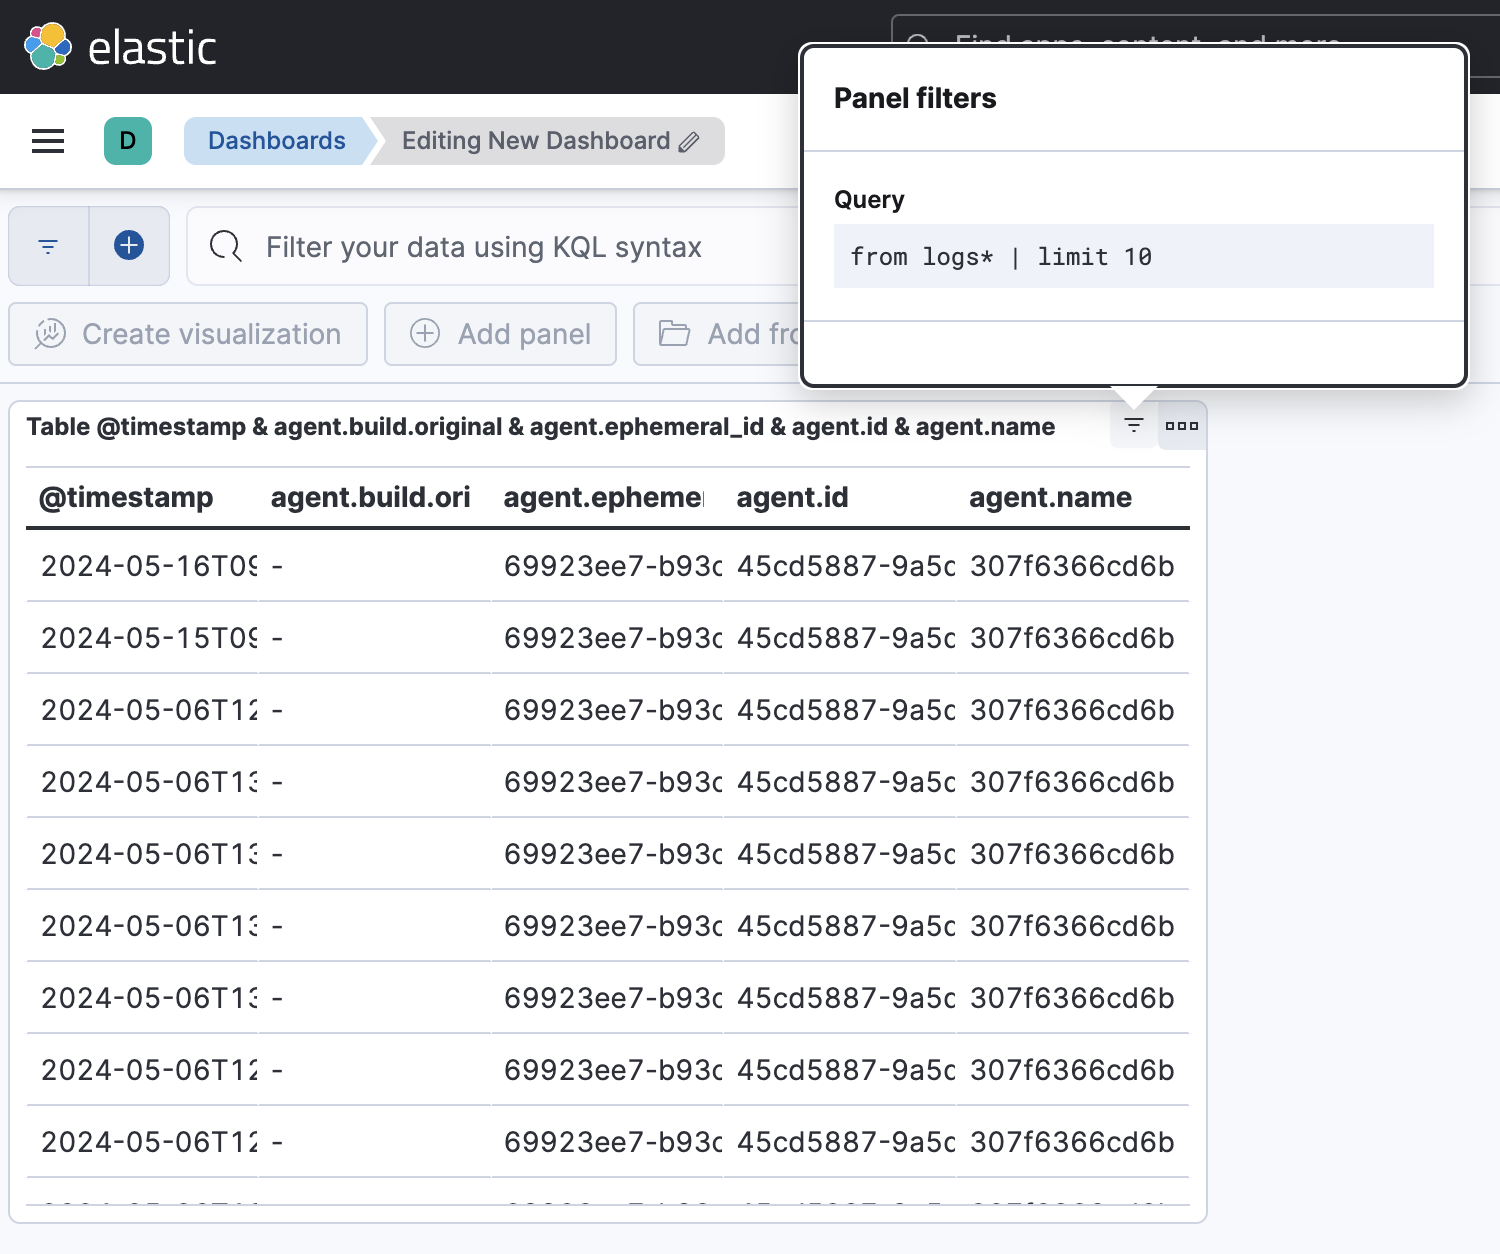
Check the ES|QL query by clicking the Panel filters button ( ):
):
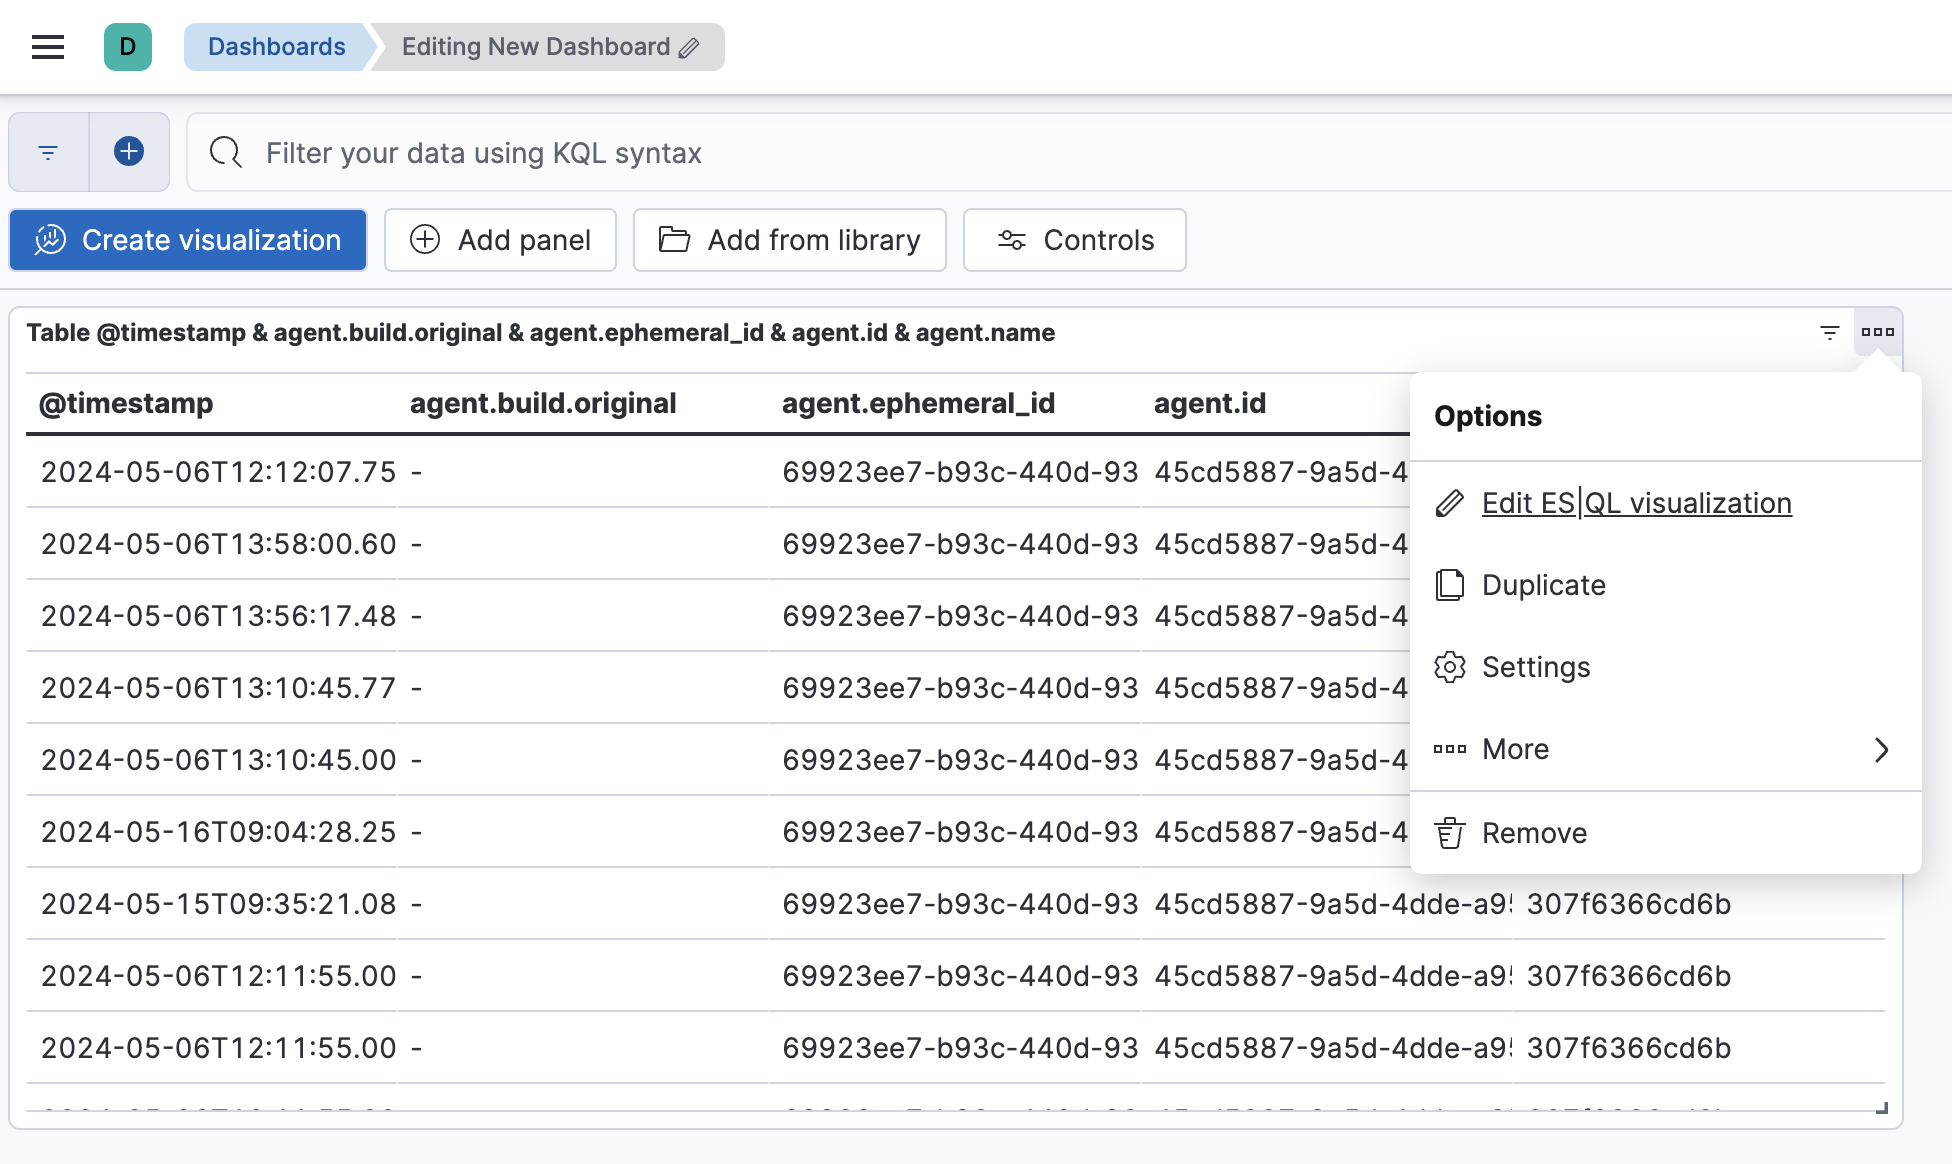
You can also edit the ES|QL visualization from here.
Click the options button in the top-right () and
select Edit ESQL visualization to open the in-line editor.
Create an enrich policy
editThe ES|QL ENRICH command enables you to enrich
your query dataset with fields from another dataset. Before you can use
ENRICH, you need to create and execute an enrich
policy. If a policy exists, it will be suggested by auto-complete. If not,
click Click to create to create one.
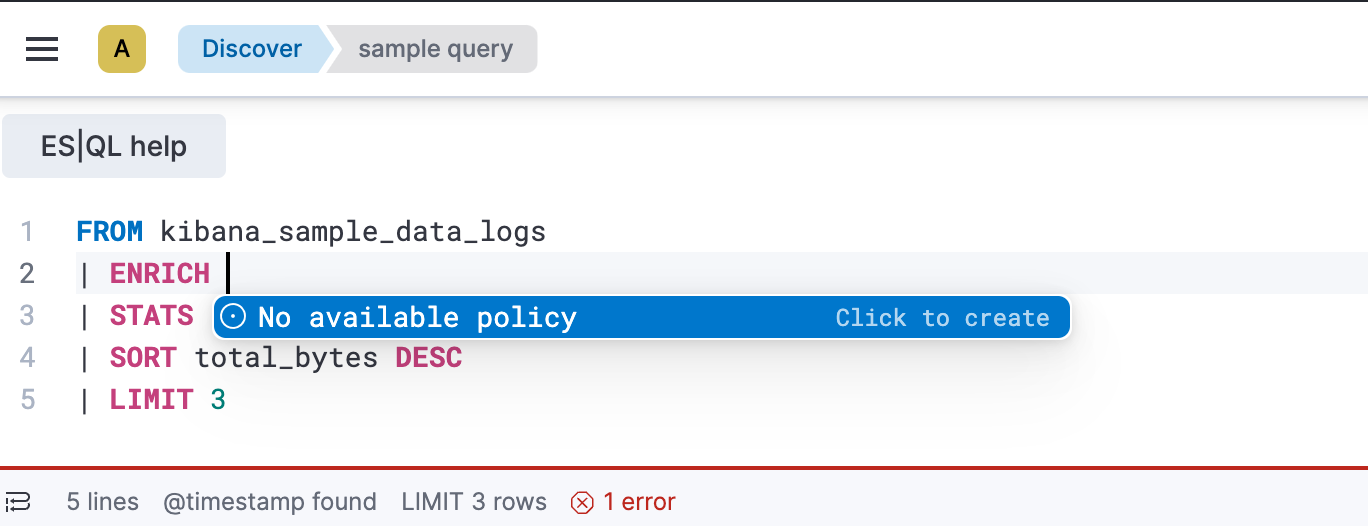
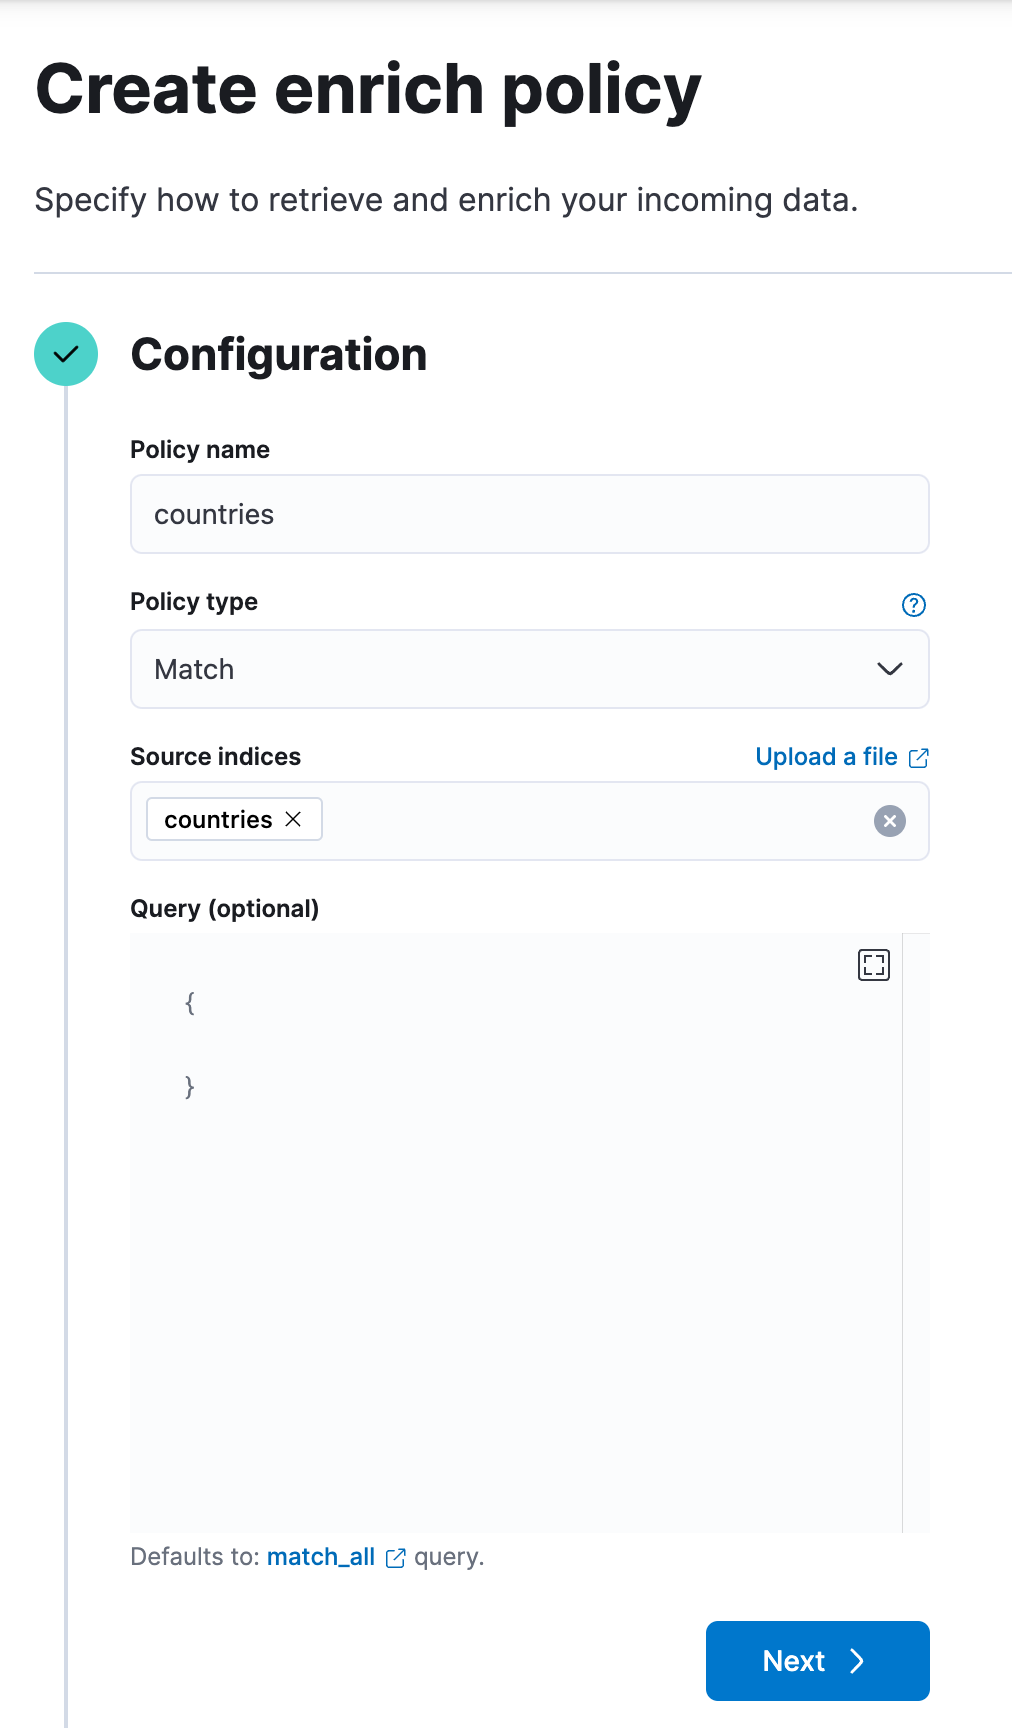
Next, you can enter a policy name, the policy type, source indices, and optionally a query:
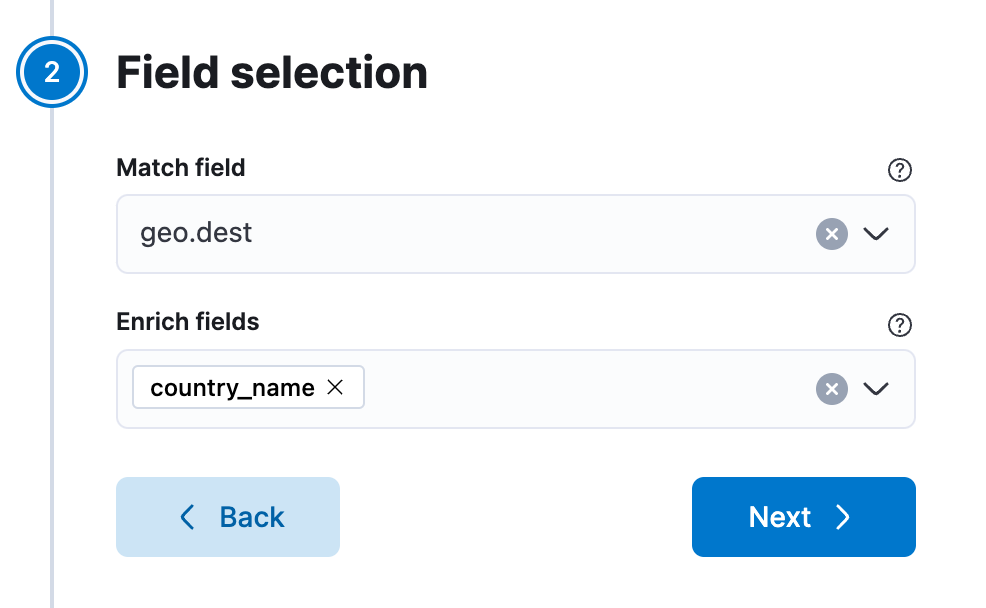
Click Next to select the match field and enrich fields:
Finally, click Create and execute.
Now, you can use the enrich policy in an ES|QL query:
FROM kibana_sample_data_logs
| STATS total_bytes = SUM(bytes) BY geo.dest
| SORT total_bytes DESC
| LIMIT 3
| ENRICH countries
Create an alerting rule
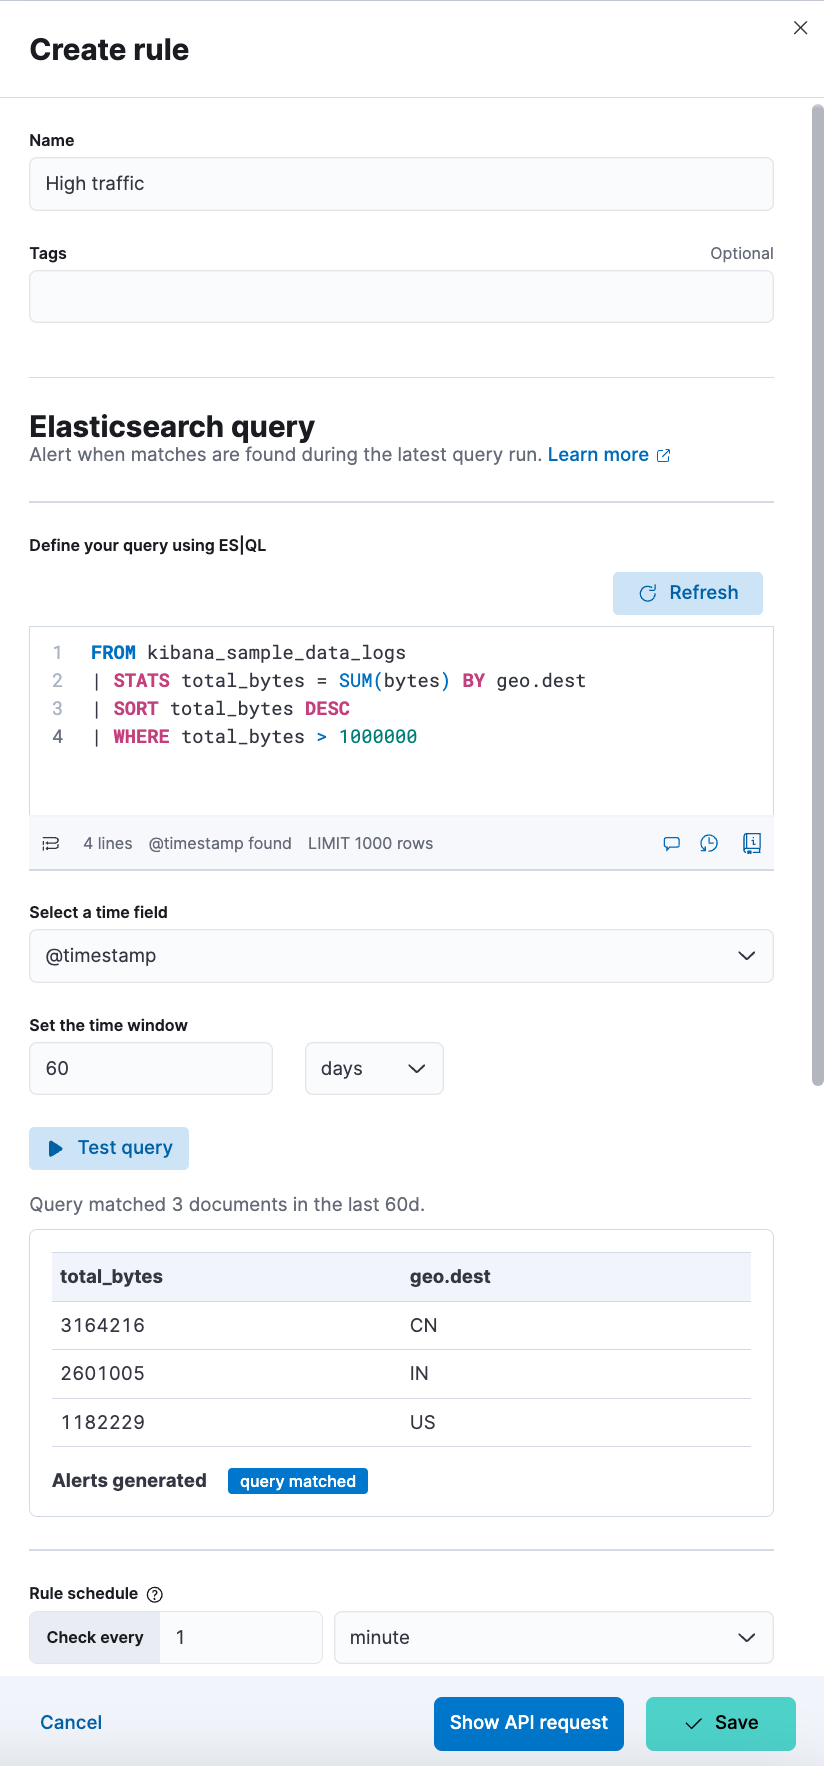
editYou can use ES|QL queries to create alerts. From Discover, click Alerts and select Create search threshold rule. This opens a panel that enables you to create a rule using an ES|QL query. Next, you can test the query, add a connector, and save the rule.
Limitations
edit-
The user interface to filter data is not enabled when Discover is in ES|QL
mode. To filter data, write a query that uses the
WHEREcommand instead. - Discover shows no more than 10,000 rows. This limit only applies to the number of rows that are retrieved by the query and displayed in Discover. Queries and aggregations run on the full data set.
- Discover shows no more than 50 columns. If a query returns more than 50 columns, Discover only shows the first 50.
- CSV export from Discover shows no more than 10,000 rows. This limit only applies to the number of rows that are retrieved by the query and displayed in Discover. Queries and aggregations run on the full data set.
-
Querying many indices at once without any filters can cause an error in
kibana which looks like
[esql] > Unexpected error from Elasticsearch: The
content length (536885793) is bigger than the maximum allowed string
(536870888)
. The response from ES|QL is too long. UseDROPorKEEPto limit the number of fields returned.