Google Cloud Platform module
editGoogle Cloud Platform module
editThis module periodically fetches monitoring metrics from Google Cloud Platform using Stackdriver Monitoring API for Google Cloud Platform services.
Extra GCP charges on Stackdriver Monitoring API requests may be generated by this module. Please see rough estimation of the number of API calls for more details.
Module config and parameters
editThis is a list of the possible module parameters you can tune:
-
zone: A single string with the zone you want to monitor like
us-central1-a. Or you can specific a partial zone name likeus-central1-orus-central1-*, which will monitor all zones start withus-central1-:us-central1-a,us-central1-b,us-central1-candus-central1-f. Please see GCP zones for zones that are available in GCP. -
region: A single string with the region you want to monitor like
us-central1. This will enable monitoring for all zones under this region. Or you can specific a partial region name likeus-eastorus-east*, which will monitor all regions start withus-east:us-east1andus-east4. If both region and zone are configured, only region will be used. Please see GCP regions for regions that are available in GCP. If bothregionandzoneare not specified, metrics will be collected from all regions/zones. - project_id: A single string with your GCP Project ID
- credentials_file_path: A single string pointing to the JSON file path reachable by Metricbeat that you have created using IAM.
-
exclude_labels: (
true/falsedefaultfalse) Do not extract extra labels and metadata information from metricsets and fetch metrics only. At the moment, labels and metadata extraction is only supported incomputemetricset. - period: A single time duration specified for this module collection frequency.
Example configuration
edit-
computemetricset is enabled to collect metrics fromus-central1-azone inelastic-observabilityproject.- module: gcp metricsets: - compute zone: "us-central1-a" project_id: "elastic-observability" credentials_file_path: "your JSON credentials file path" exclude_labels: false period: 60s -
computeandpubsubmetricsets are enabled to collect metrics from all zones underus-central1region inelastic-observabilityproject.- module: gcp metricsets: - compute - pubsub region: "us-central1" project_id: "elastic-observability" credentials_file_path: "your JSON credentials file path" exclude_labels: false period: 60s -
computemetricset is enabled to collect metrics from all regions starts withus-westinelastic-observabilityproject, which includes all zones underus-west1,us-west2,us-west3andus-west4.- module: gcp metricsets: - compute - pubsub region: "us-west" project_id: "elastic-observability" credentials_file_path: "your JSON credentials file path" exclude_labels: false period: 60s
Authentication, authorization and permissions.
editAuthentication and authorization in Google Cloud Platform can be achieved in many ways. For the current version of the Google Cloud Platform module for Metricbeat, the only supported method is using Service Account JSON files. A typical JSON with a private key looks like this:
Example Credentials
edit{
"type": "service_account",
"project_id": "your-project-id",
"private_key_id": "a_private_key_id",
"private_key": "-----BEGIN PRIVATE KEY-----your private key\n-----END PRIVATE KEY-----\n",
"client_email": "[email protected]",
"client_id": "123456",
"auth_uri": "https://accounts.google.com/o/oauth2/auth",
"token_uri": "https://oauth2.googleapis.com/token",
"auth_provider_x509_cert_url": "https://www.googleapis.com/oauth2/v1/certs",
"client_x509_cert_url": "https://www.googleapis.com/robot/v1/metadata/x509/metricbeat-testing%40your-project-id.iam.gserviceaccount.com"
}
Generally, you have to create a Service Account and assign it the following roles or the permissions described on each role (applies to all metricsets):
-
Monitoring Viewer:-
monitoring.metricDescriptors.list -
monitoring.timeSeries.list
-
-
Compute Viewer:-
compute.instances.get -
compute.instances.list
-
You can play in IAM pretty much with your service accounts and Instance level access to your resources (for example, allowing that everything running in an Instance is authorized to use the Compute API). The module uses Google Cloud Platform libraries for authentication so many possibilities are open but the Module is only supported by using the method mentioned above.
Google Cloud Platform module: Under the hood
editGoogle Cloud Platform offers the Stackdriver Monitoring API to fetch metrics from its services. Those metrics are retrieved one by one.
If you also want to extract service labels (by setting exclude_labels to false, which is the default state). You also make a new API check on the corresponding service. Service labels requires a new API call to extract those metrics. In the worst case the number of API calls will be doubled. In the best case, all metrics come from the same GCP entity and 100% of the required information is included in the first API call (which is cached for subsequent calls).
If period value is set to 5-minute and sample period of the metric type is 60-second, then this module will collect data from this metric type once every 5 minutes with aggregation.
GCP monitoring data has a up to 240 seconds latency, which means latest monitoring data will be up to 4 minutes old. Please see Latency of GCP Monitoring Metric Data for more details.
In gcp module, metrics are collected based on this ingest delay, which is also obtained from ListMetricDescriptors API.
Rough estimation of the number of API calls
editGoogle Cloud Platform pricing depends of the number of requests you do to their API’s. Here you have some information that you can use to make an estimation of the pricing you should expect. For example, imagine that you have a Compute Metricset activated and you don’t want to exclude labels. You have a total of 20 instances running in a particular GCP project, region and zone.
For example, if Compute Metricset fetches 14 metrics (which is the number of metrics fetched in the early beta version). Each of those metrics will attempt an API call to Compute API to retrieve also their metadata. Because you have 20 different instances, the total number of API calls that will be done on each refresh period are: 14 metrics + 20 instances = 34 API requests every 5 minutes if that is your current Period. 9792 API requests per day with one zone. If you add 2 zones more with the same amount of instances you’ll have 19584 API requests per day (9792 on each zone) or around 587520 per month for the Compute Metricset. This maths must be done for each different Metricset with slight variations.
Metricsets
editCurrently, we have billing, compute, gke, loadbalancing, pubsub, metrics and
storage metricset in gcp module.
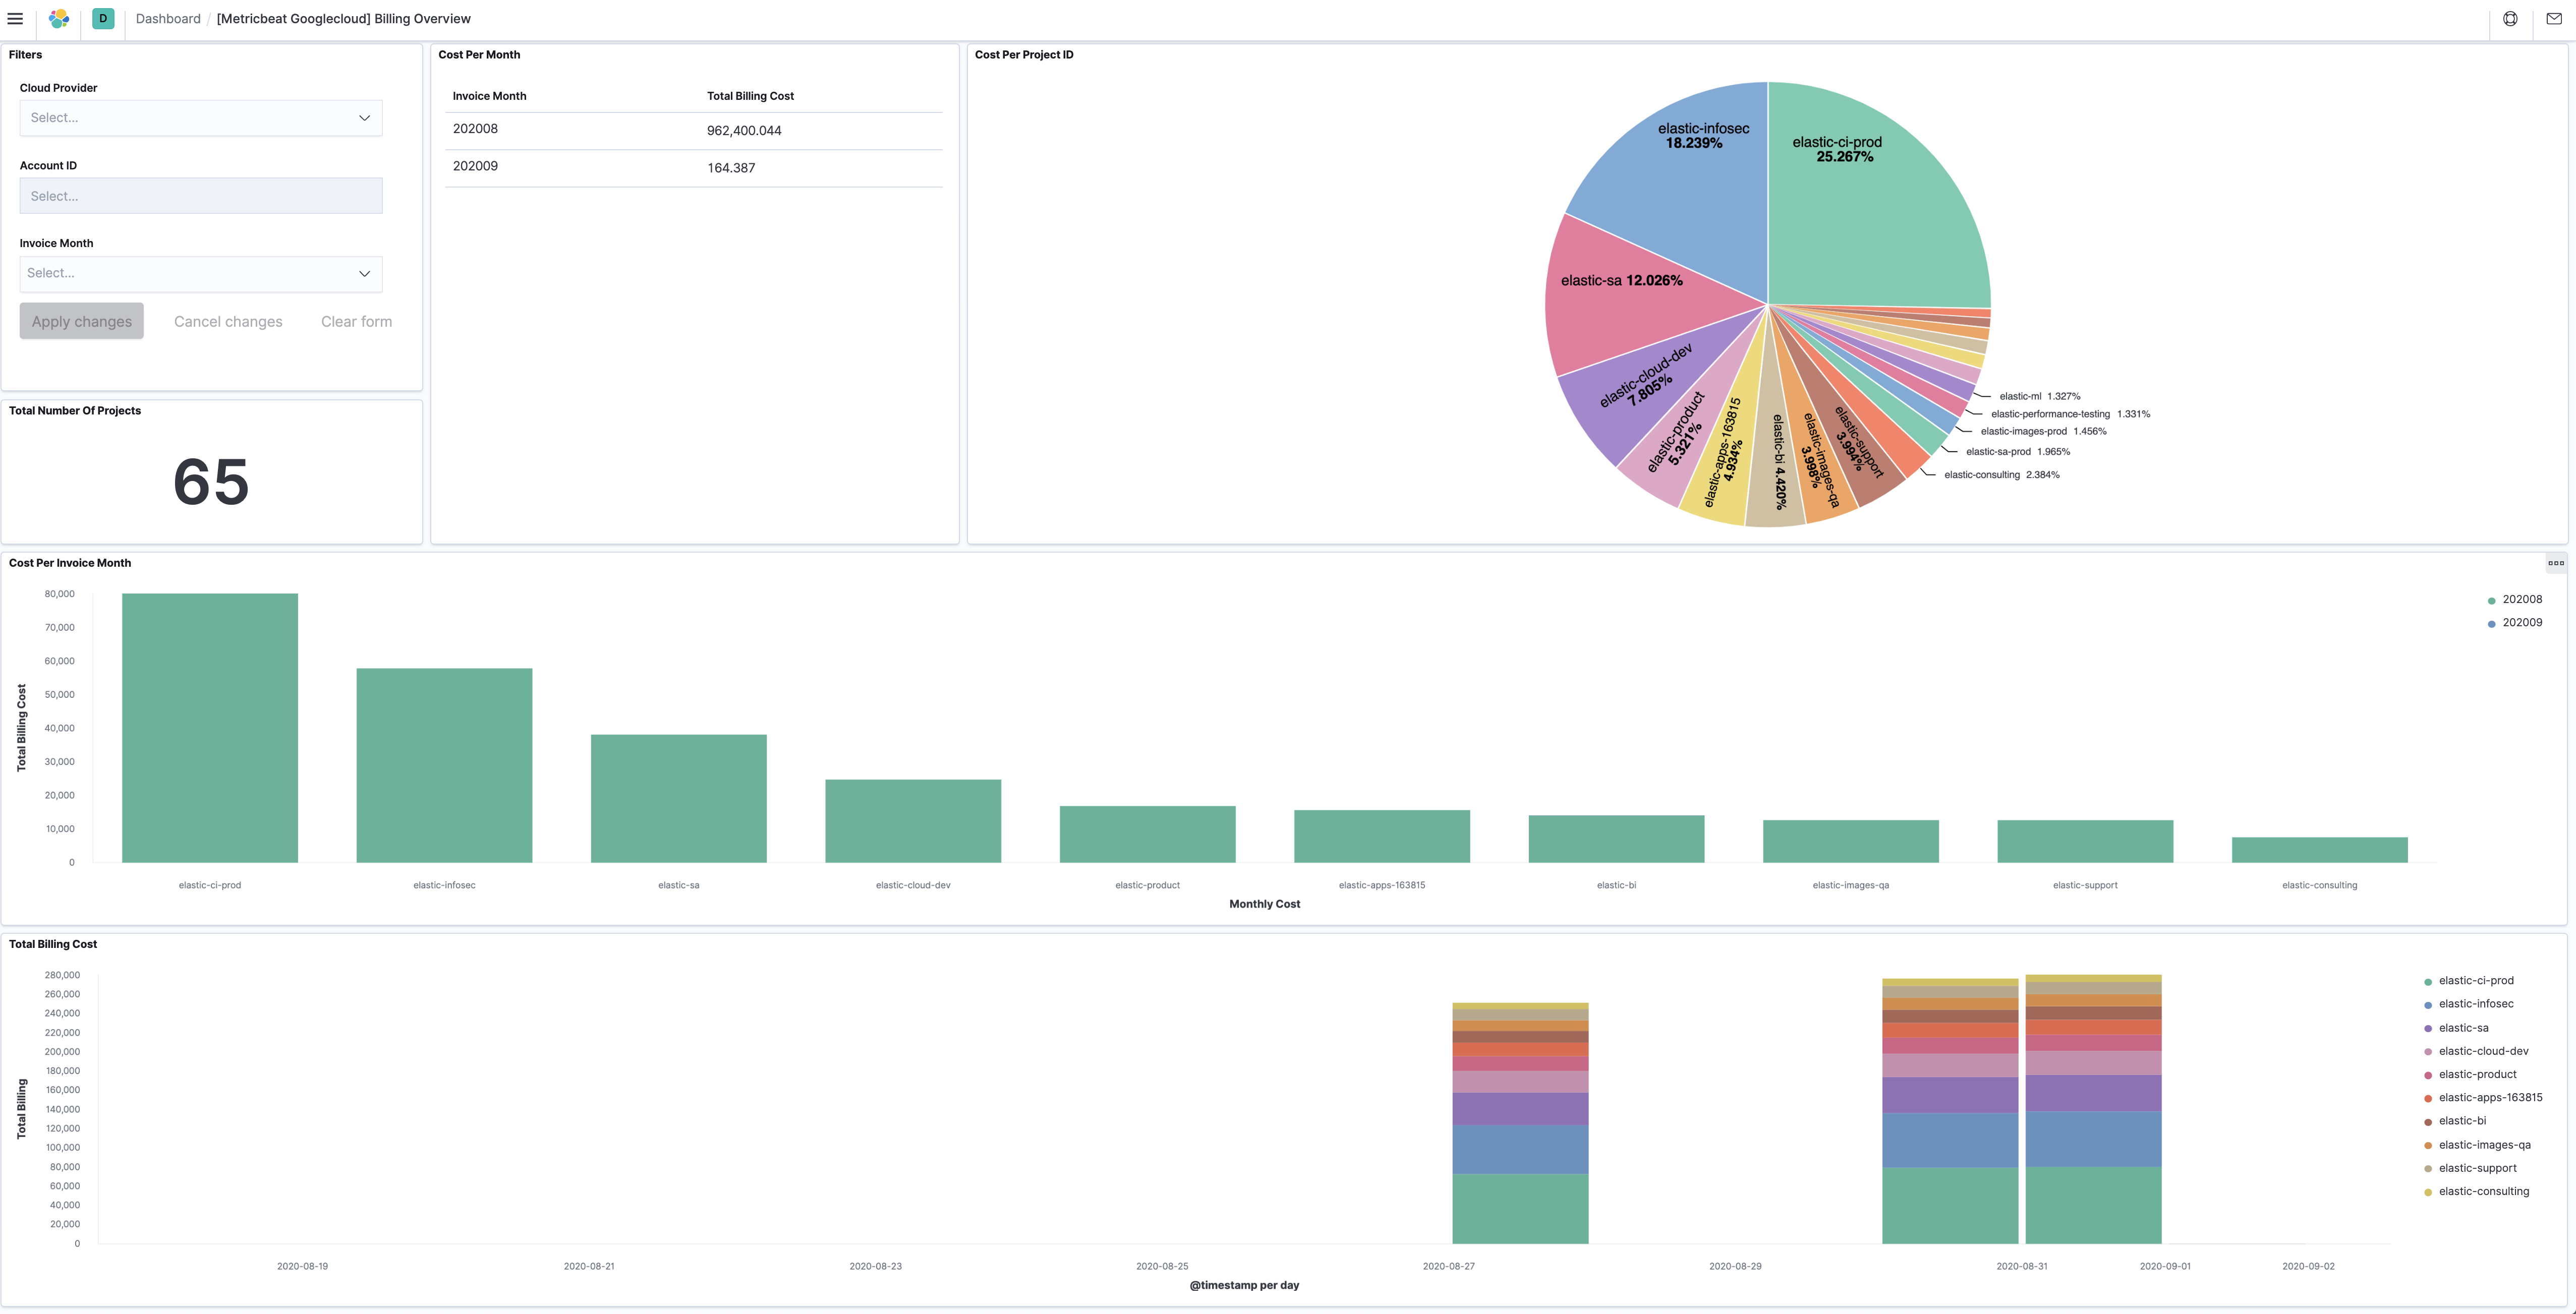
billing
editThis metricset fetches billing metrics from GCP BigQuery Cloud Billing allows users to export billing data into BigQuery automatically throughout the day. This metricset gets access to the daily cost detail table periodically to export billing metrics for further analysis.
The billing metricset comes with a predefined dashboard:
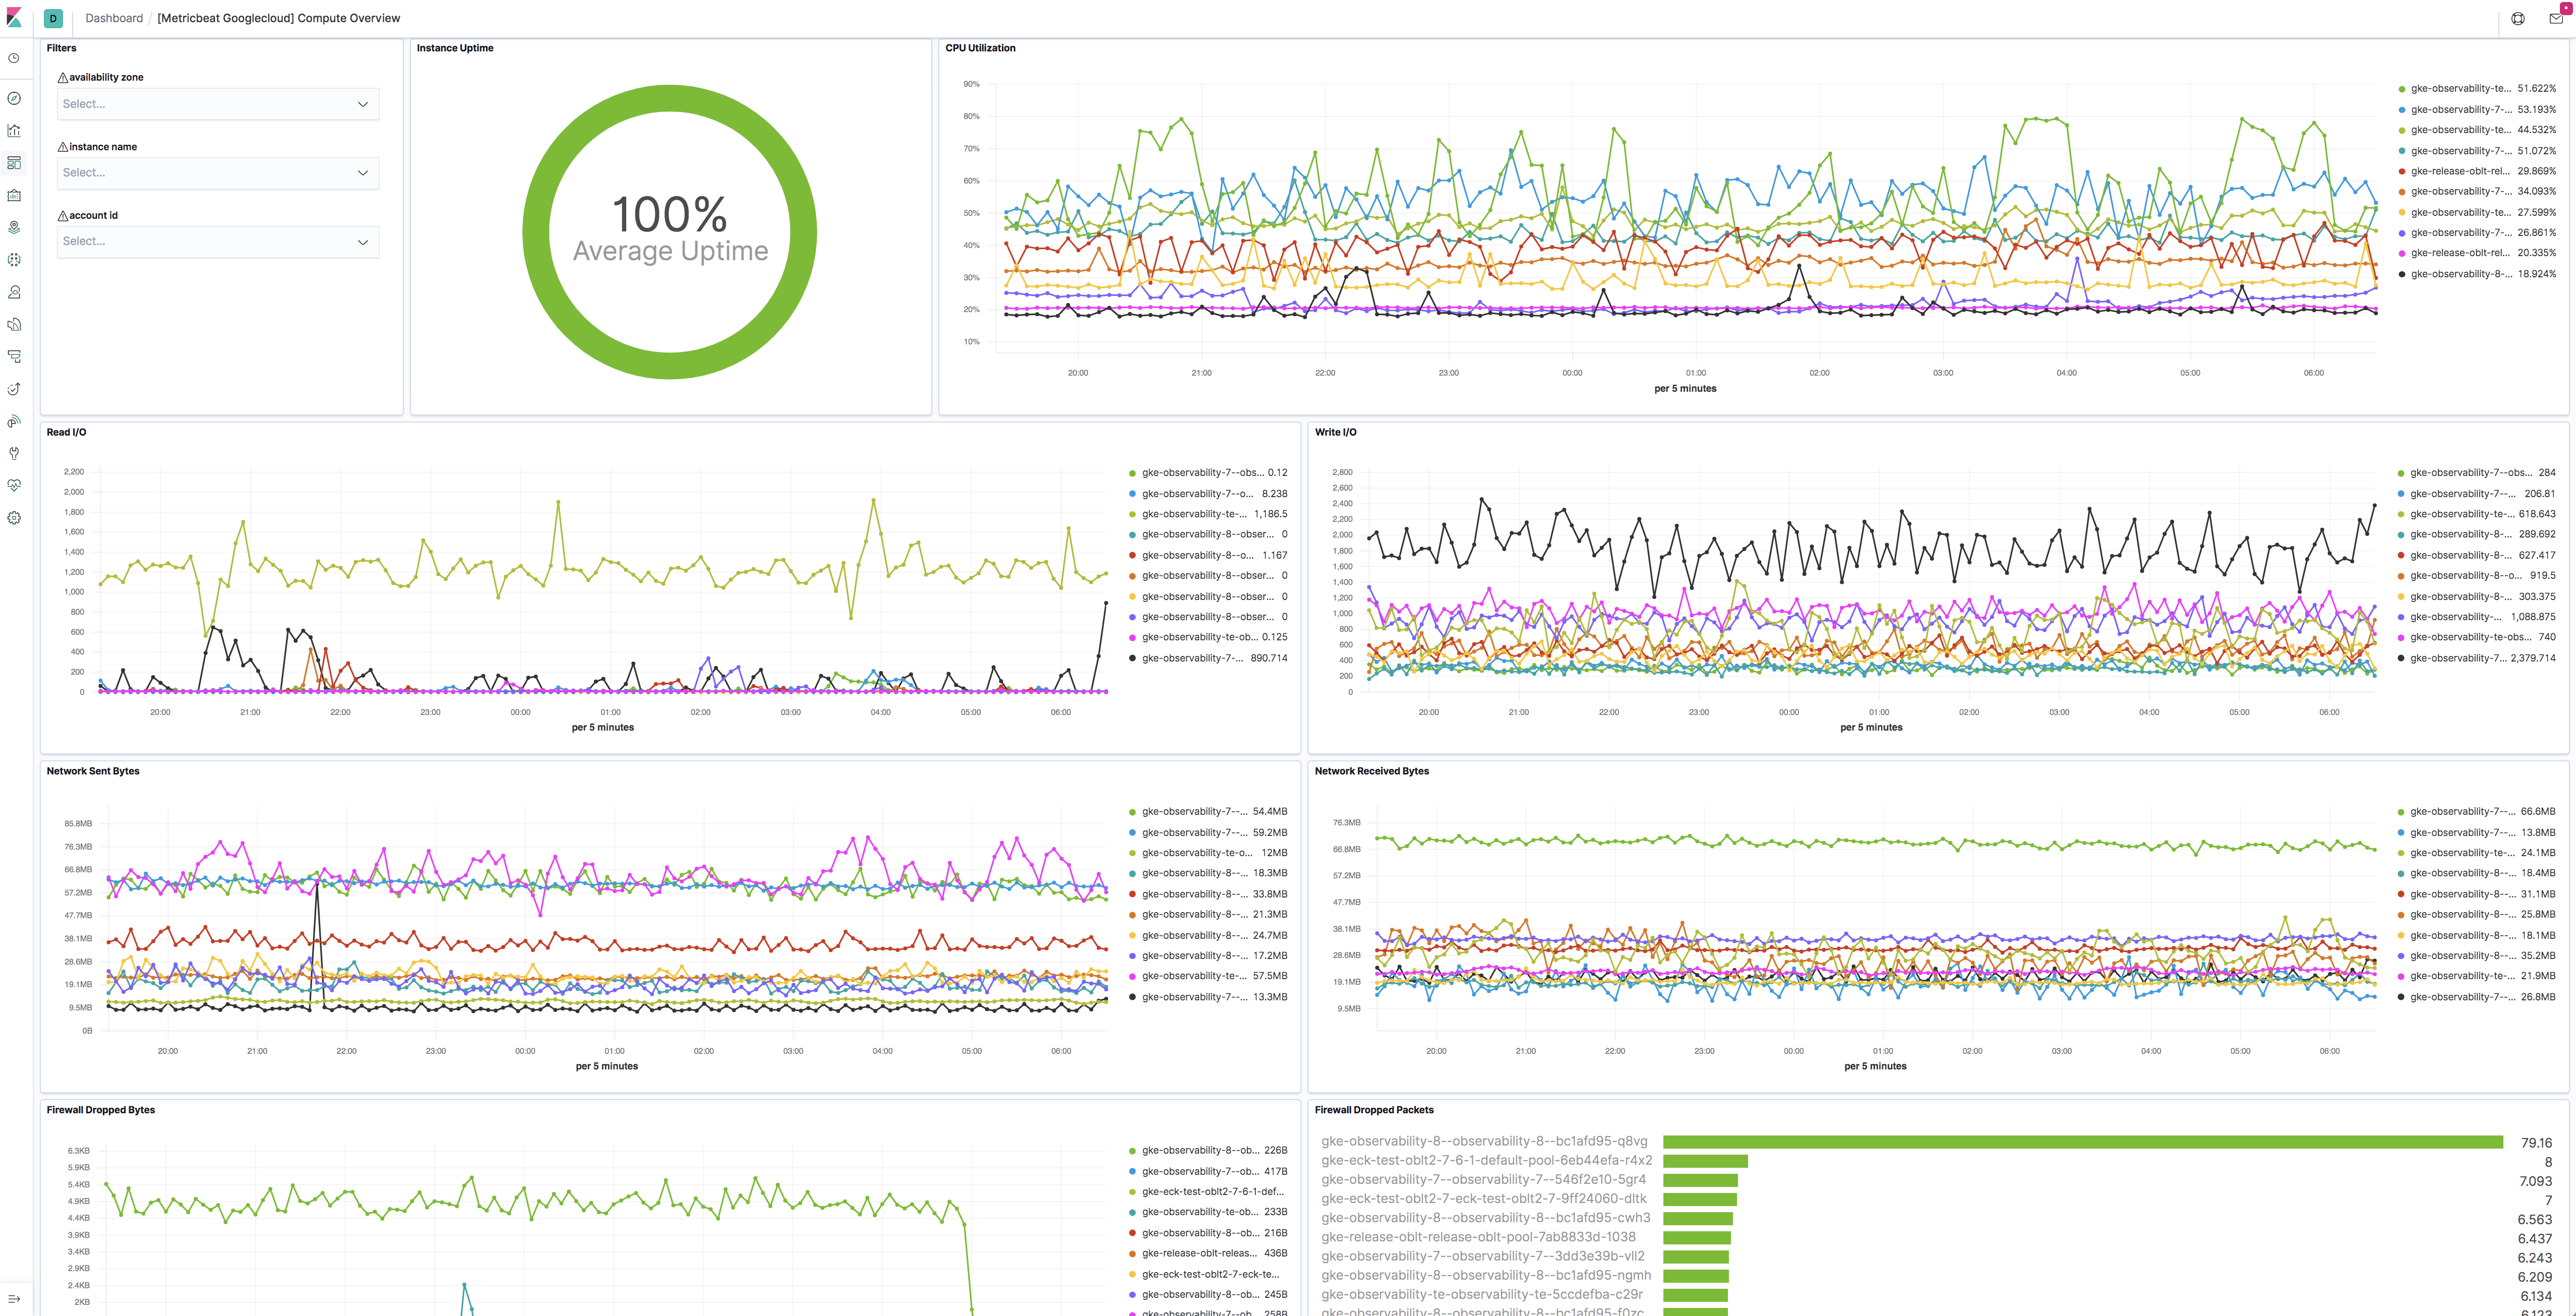
compute
editThis metricset fetches metrics from Compute Engine
Virtual Machines in Google Cloud Platform. The compute metricset contains some
of the metrics exported from the GCP Compute Monitoring API.
Extra labels and metadata are also extracted using the Compute API.
This is enough to get most of the info associated with a metric like compute
labels and metadata and metric specific Labels.
The compute metricset comes with a predefined dashboard:
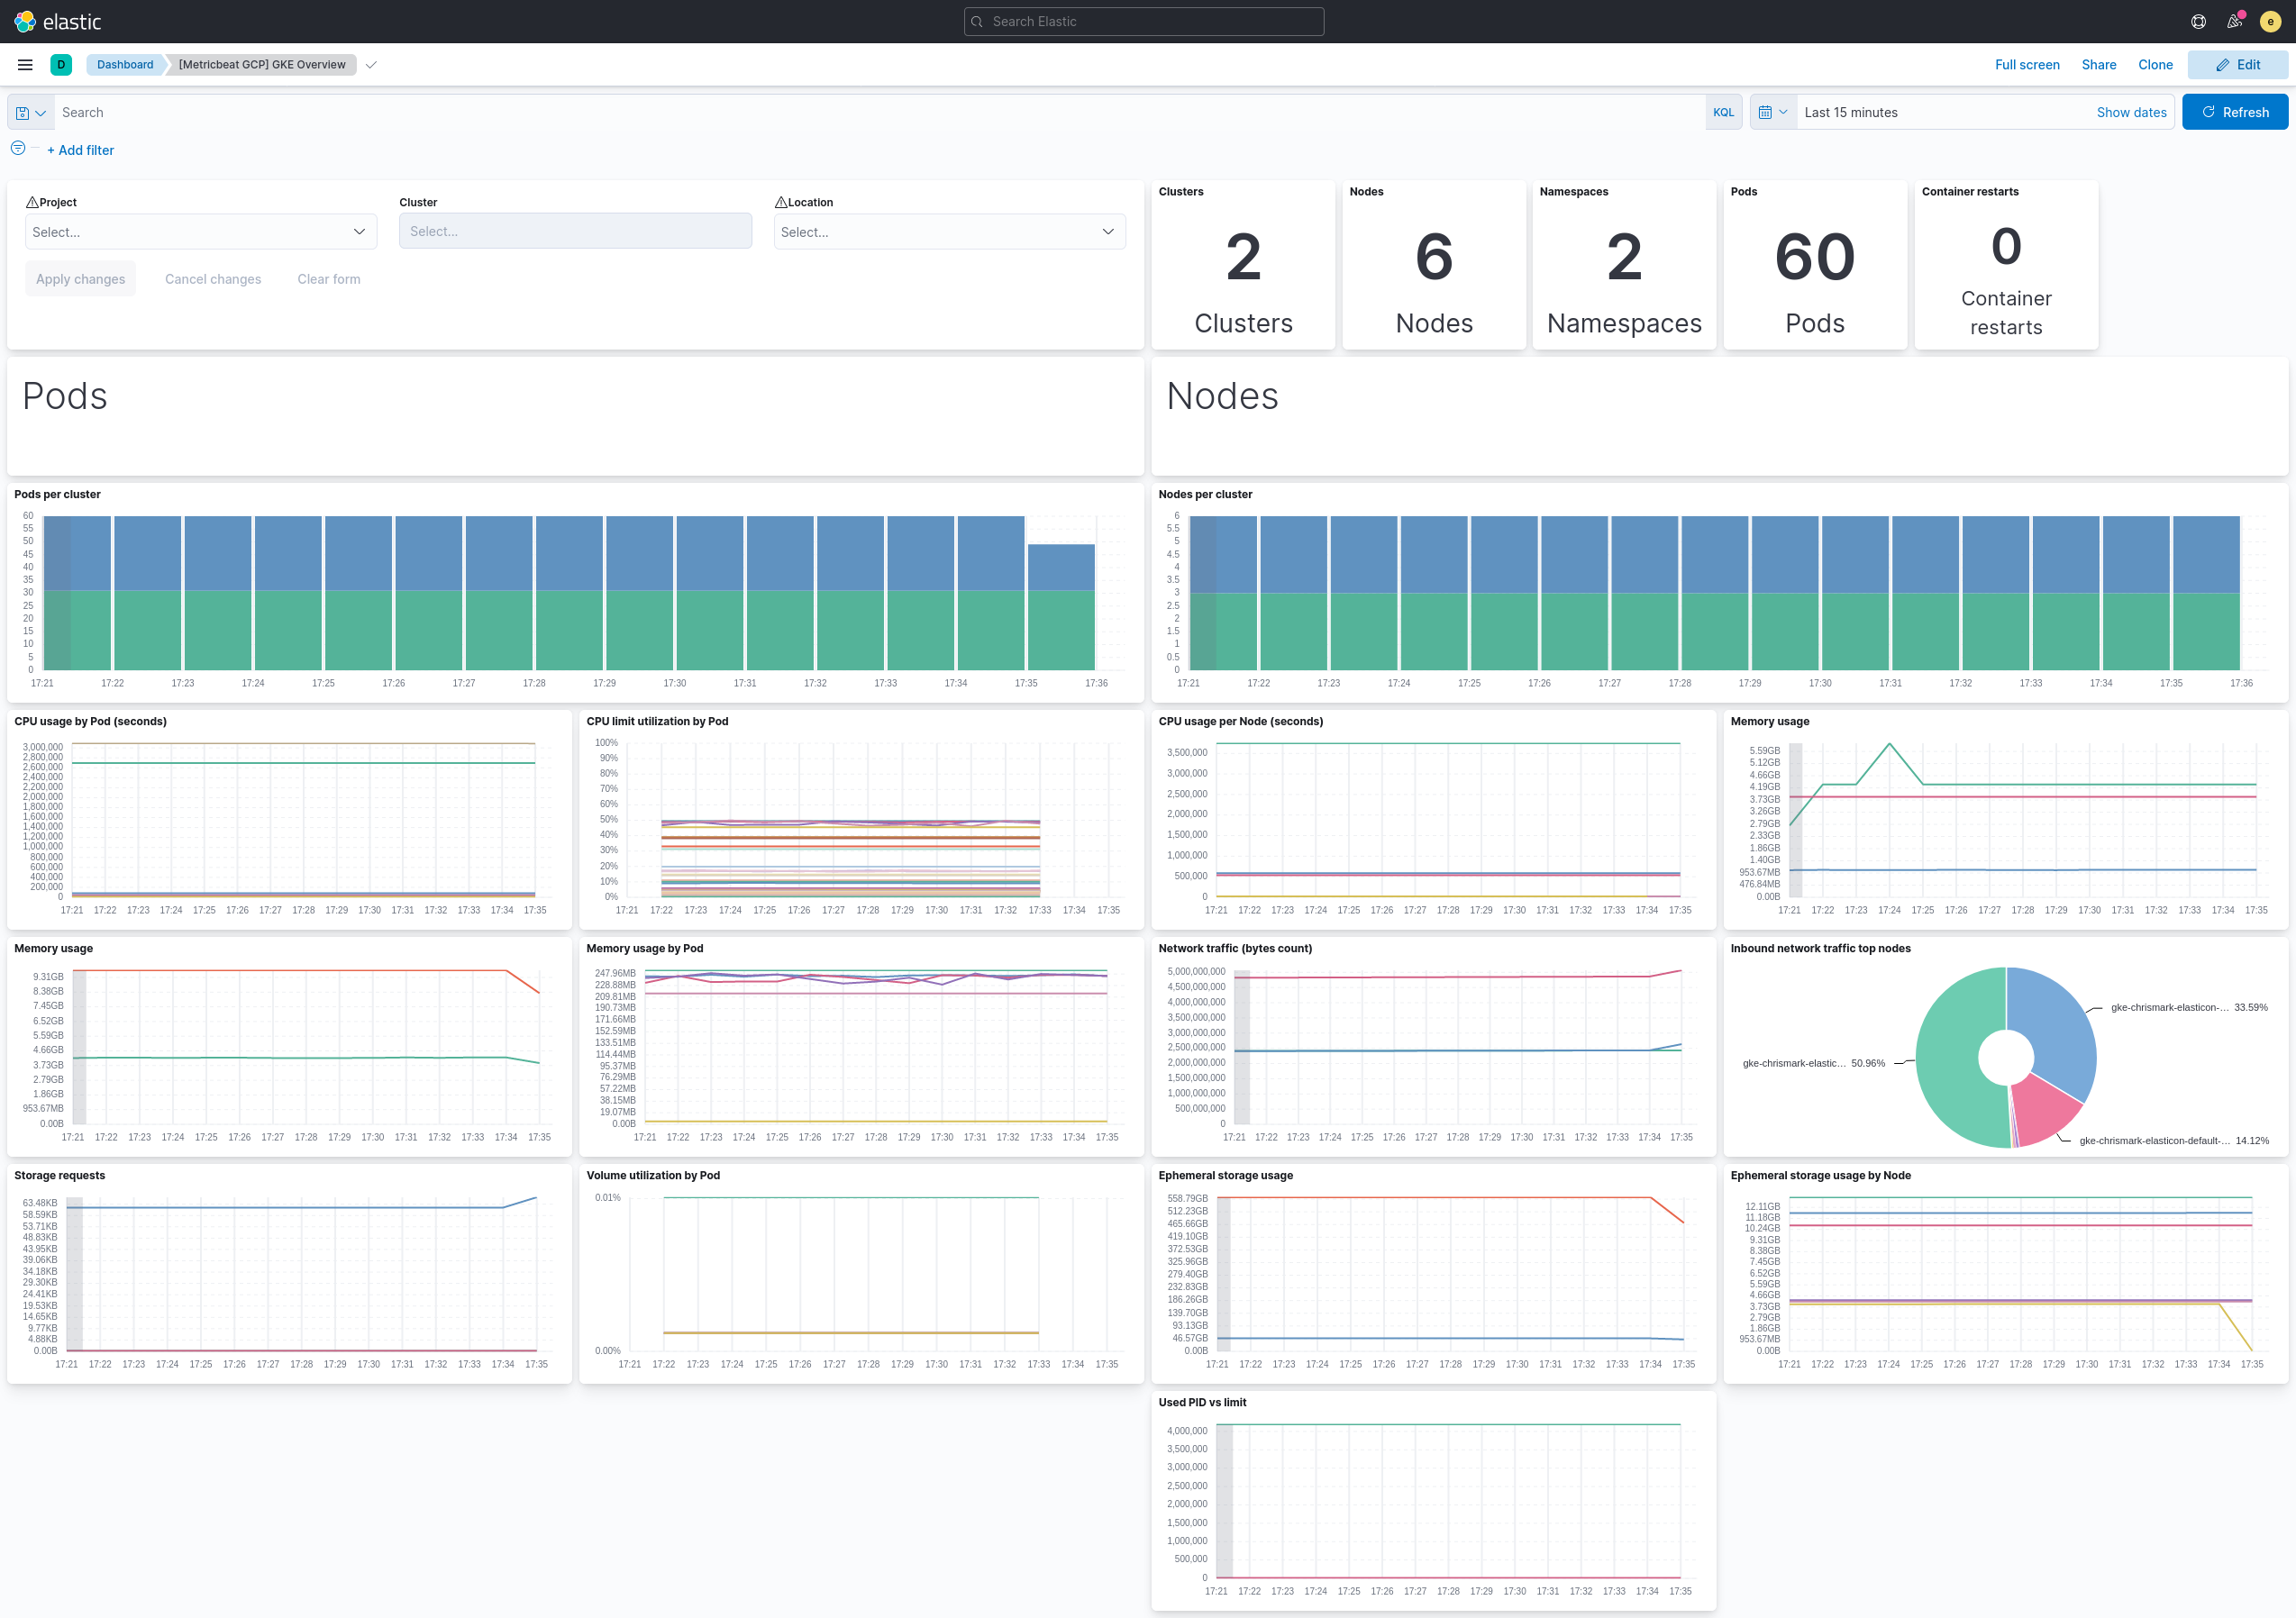
gke
editThis metricset fetches metrics for Kubernetes Engine.
The gke metricset contains all GA metrics exported by Cloud Monitoring Kubernetes metrics.
Extra labels and metadata are also extracted using the Compute API.
The gke metricset comes with a predefined dashboard:
loadbalancing
editThis metricset fetches metrics from Load Balancing
in Google Cloud Platform. The loadbalancing metricset contains all metrics
exported from the GCP Load Balancing Monitoring API.
The loadbalancing metricset comes with two predefined dashboards:
HTTPS
editFor HTTPS load balancing: image::./images/metricbeat-gcp-load-balancing-https-overview.png[]
L3
editFor L3 load balancing: image::./images/metricbeat-gcp-load-balancing-l3-overview.png[]
TCP/SSL/Proxy
editFor TCP/SSL/Proxy load balancing: image::./images/metricbeat-gcp-load-balancing-tcp-ssl-proxy-overview.png[]
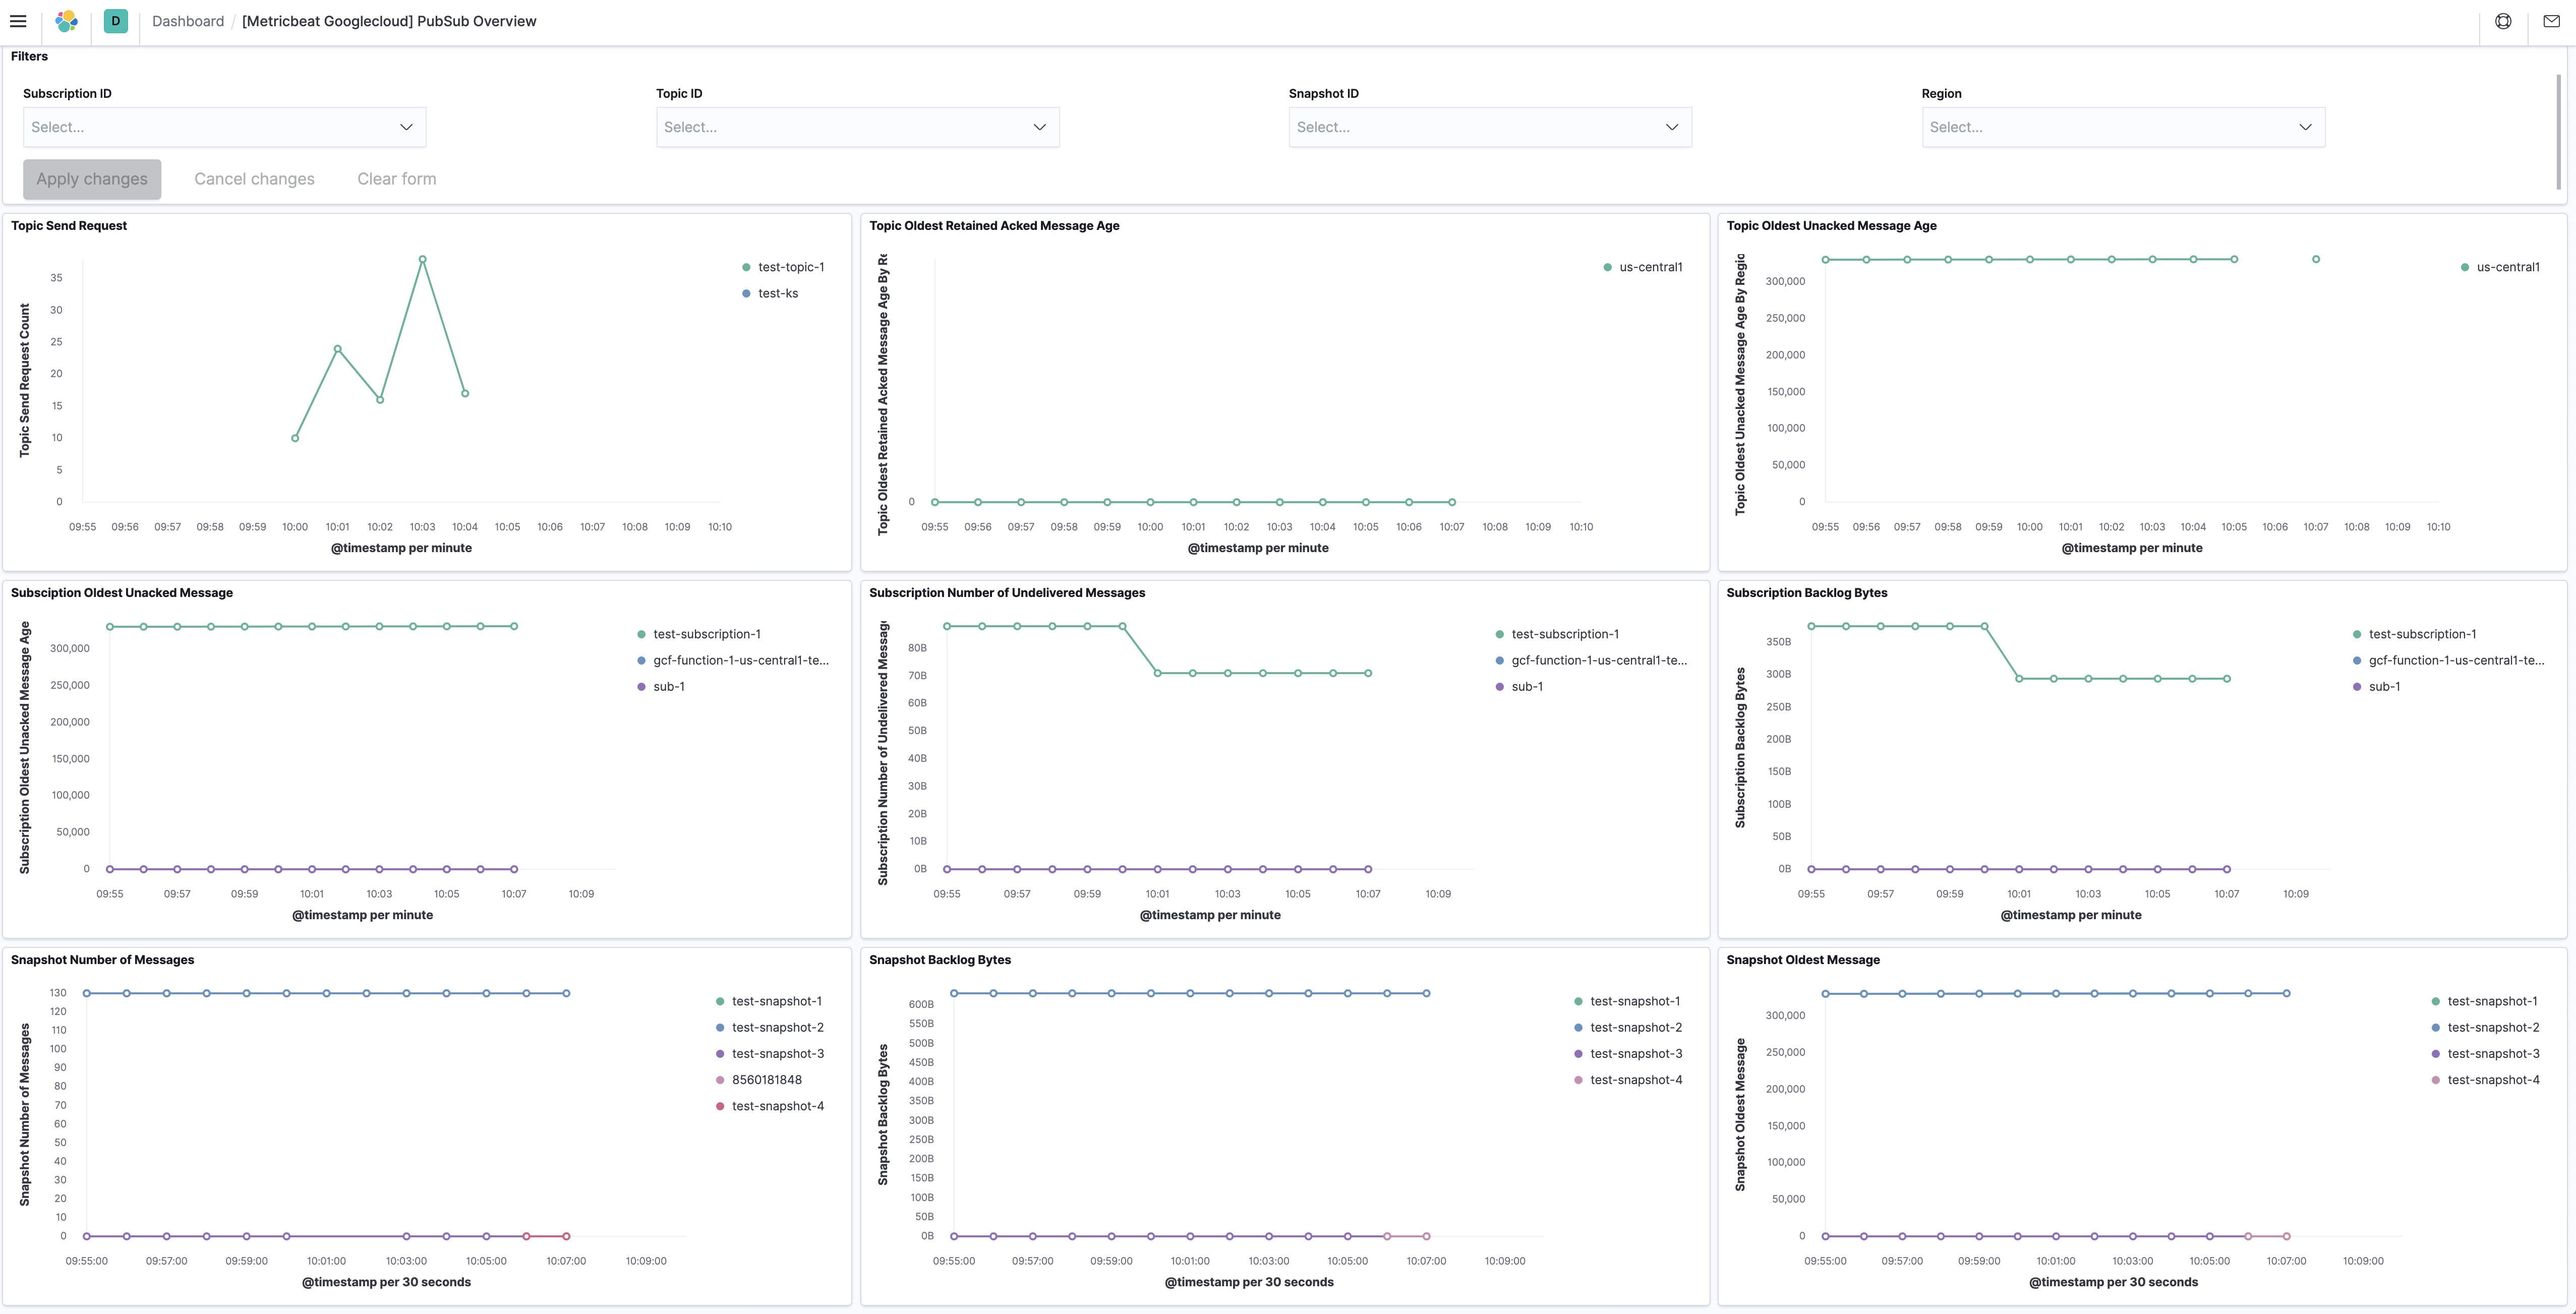
pubsub
editThis metricset fetches metrics from Pub/Sub
topics and subscriptions in Google Cloud Platform. The pubsub metricset
contains all GA stage metrics exported from the
GCP PubSub Monitoring API.
The pubsub metricset comes with a predefined dashboard:
metrics
editmetrics metricset uses Google Cloud Operations/Stackdriver, which provides
visibility into the performance, uptime, and overall health of cloud-powered
applications. It collects metrics, events, and metadata from different services
from Google Cloud.
This metricset is to collect monitoring metrics
from Google Cloud using ListTimeSeries API.
storage
editThis metricset fetches metrics from Storage
in Google Cloud Platform. The storage metricset contains all GA metrics
exported from the GCP Storage Monitoring API.
We recommend users to define period: 5m for this metricset because in Google
Cloud, storage monitoring metrics are written every 5-minute sample period with
a 10-minute ingest delay.
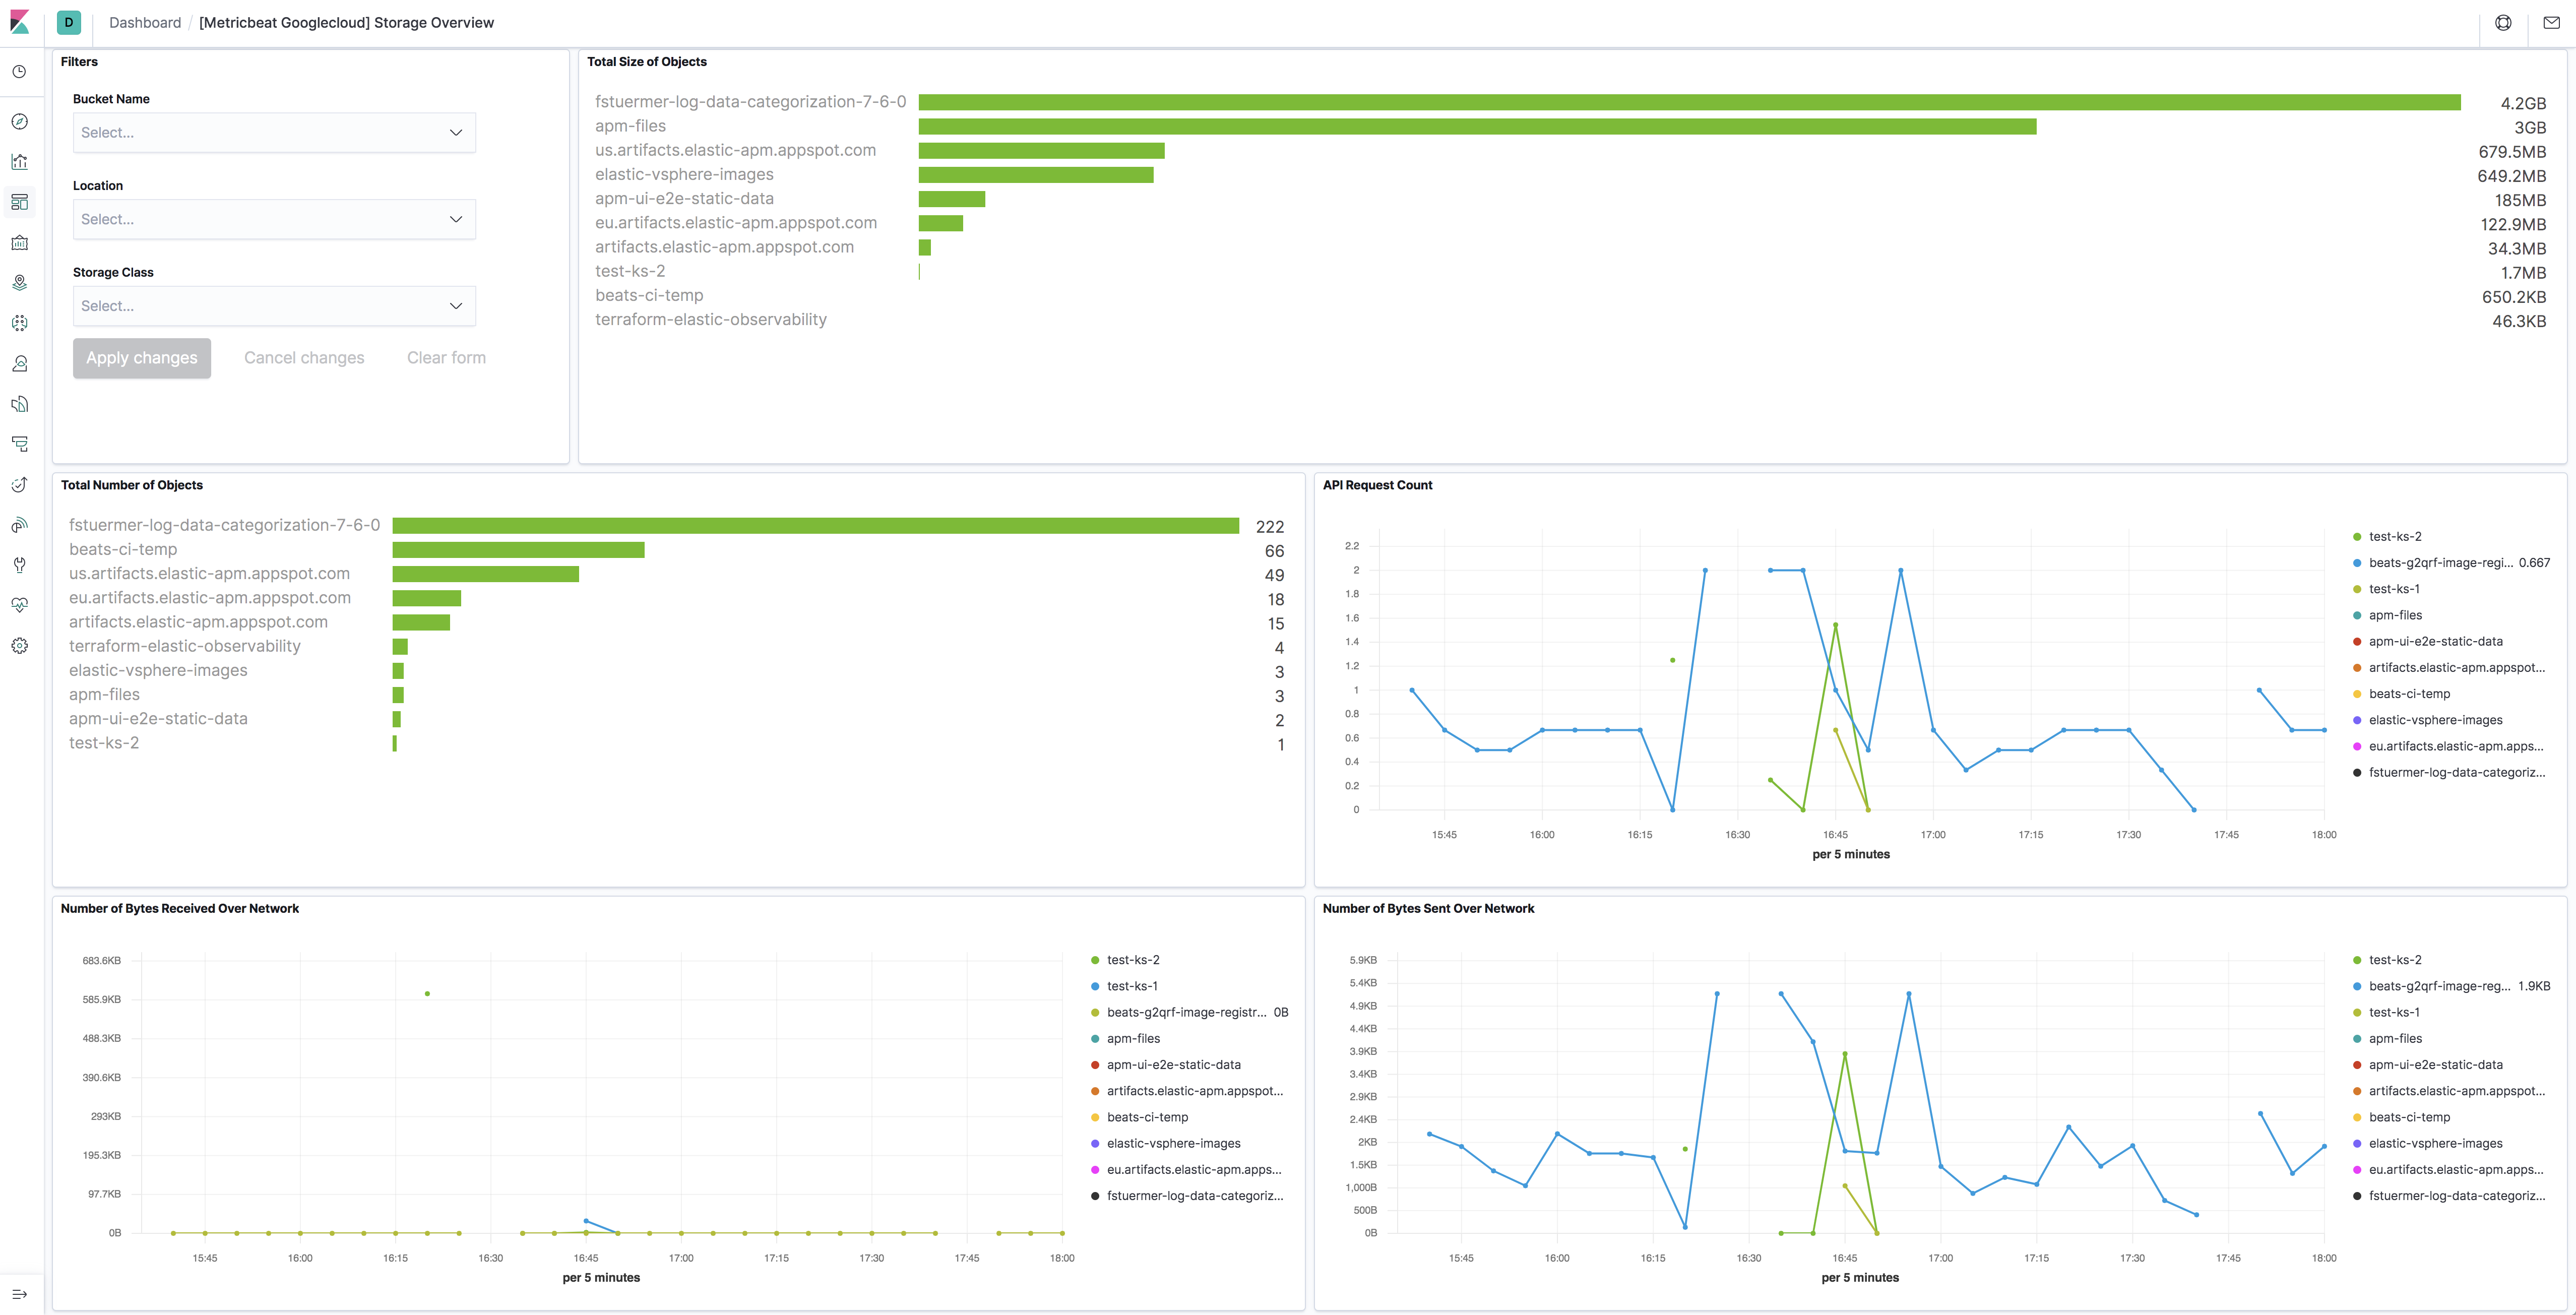
The storage metricset comes with a predefined dashboard:
The Google Cloud Platform module supports the standard configuration options that are described in Modules. Here is an example configuration:
metricbeat.modules:
- module: gcp
  metricsets:
    - compute
  region: "us-"
  project_id: "your project id"
  credentials_file_path: "your JSON credentials file path"
  exclude_labels: false
  period: 1m

- module: gcp
  metricsets:
    - pubsub
    - loadbalancing
    - firestore
    - dataproc
  zone: "us-central1-a"
  project_id: "your project id"
  credentials_file_path: "your JSON credentials file path"
  exclude_labels: false
  period: 1m

- module: gcp
  metricsets:
    - storage
  project_id: "your project id"
  credentials_file_path: "your JSON credentials file path"
  exclude_labels: false
  period: 5m

- module: gcp
  metricsets:
    - metrics
  project_id: "your project id"
  credentials_file_path: "your JSON credentials file path"
  exclude_labels: false
  period: 1m
  metrics:
    - aligner: ALIGN_NONE
      service: compute
      metric_types:
        - "instance/cpu/reserved_cores"
        - "instance/cpu/usage_time"
        - "instance/cpu/utilization"
        - "instance/uptime"

- module: gcp
  metricsets:
    - gke
  project_id: "your project id"
  credentials_file_path: "your JSON credentials file path"
  exclude_labels: false
  period: 1m

- module: gcp
  metricsets:
    - billing
  period: 24h
  project_id: "your project id"
  credentials_file_path: "your JSON credentials file path"
  dataset_id: "dataset id"
  table_pattern: "table pattern"
  cost_type: "regular"
The following metricsets are available: