aws module
editaws module
editThis module periodically fetches monitoring metrics from AWS Cloudwatch using GetMetricData API for AWS services. Note: extra AWS charges on GetMetricData API requests will be generated by this module.
The default metricsets are ec2, sqs, s3_request, s3_daily_storage, cloudwatch and rds.
Module-specific configuration notes
editThe aws module requires AWS credentials configuration in order to make AWS API calls.
Users can either use AWS_ACCESS_KEY_ID, AWS_SECRET_ACCESS_KEY and/or
AWS_SESSION_TOKEN, or use shared AWS credentials file.
Please see AWS credentials options for more details.
This module also accepts optional configuration regions to specify which
AWS regions to query metrics from. If the regions parameter is not set in the
config file, then by default, the aws module will query metrics from all available
AWS regions.
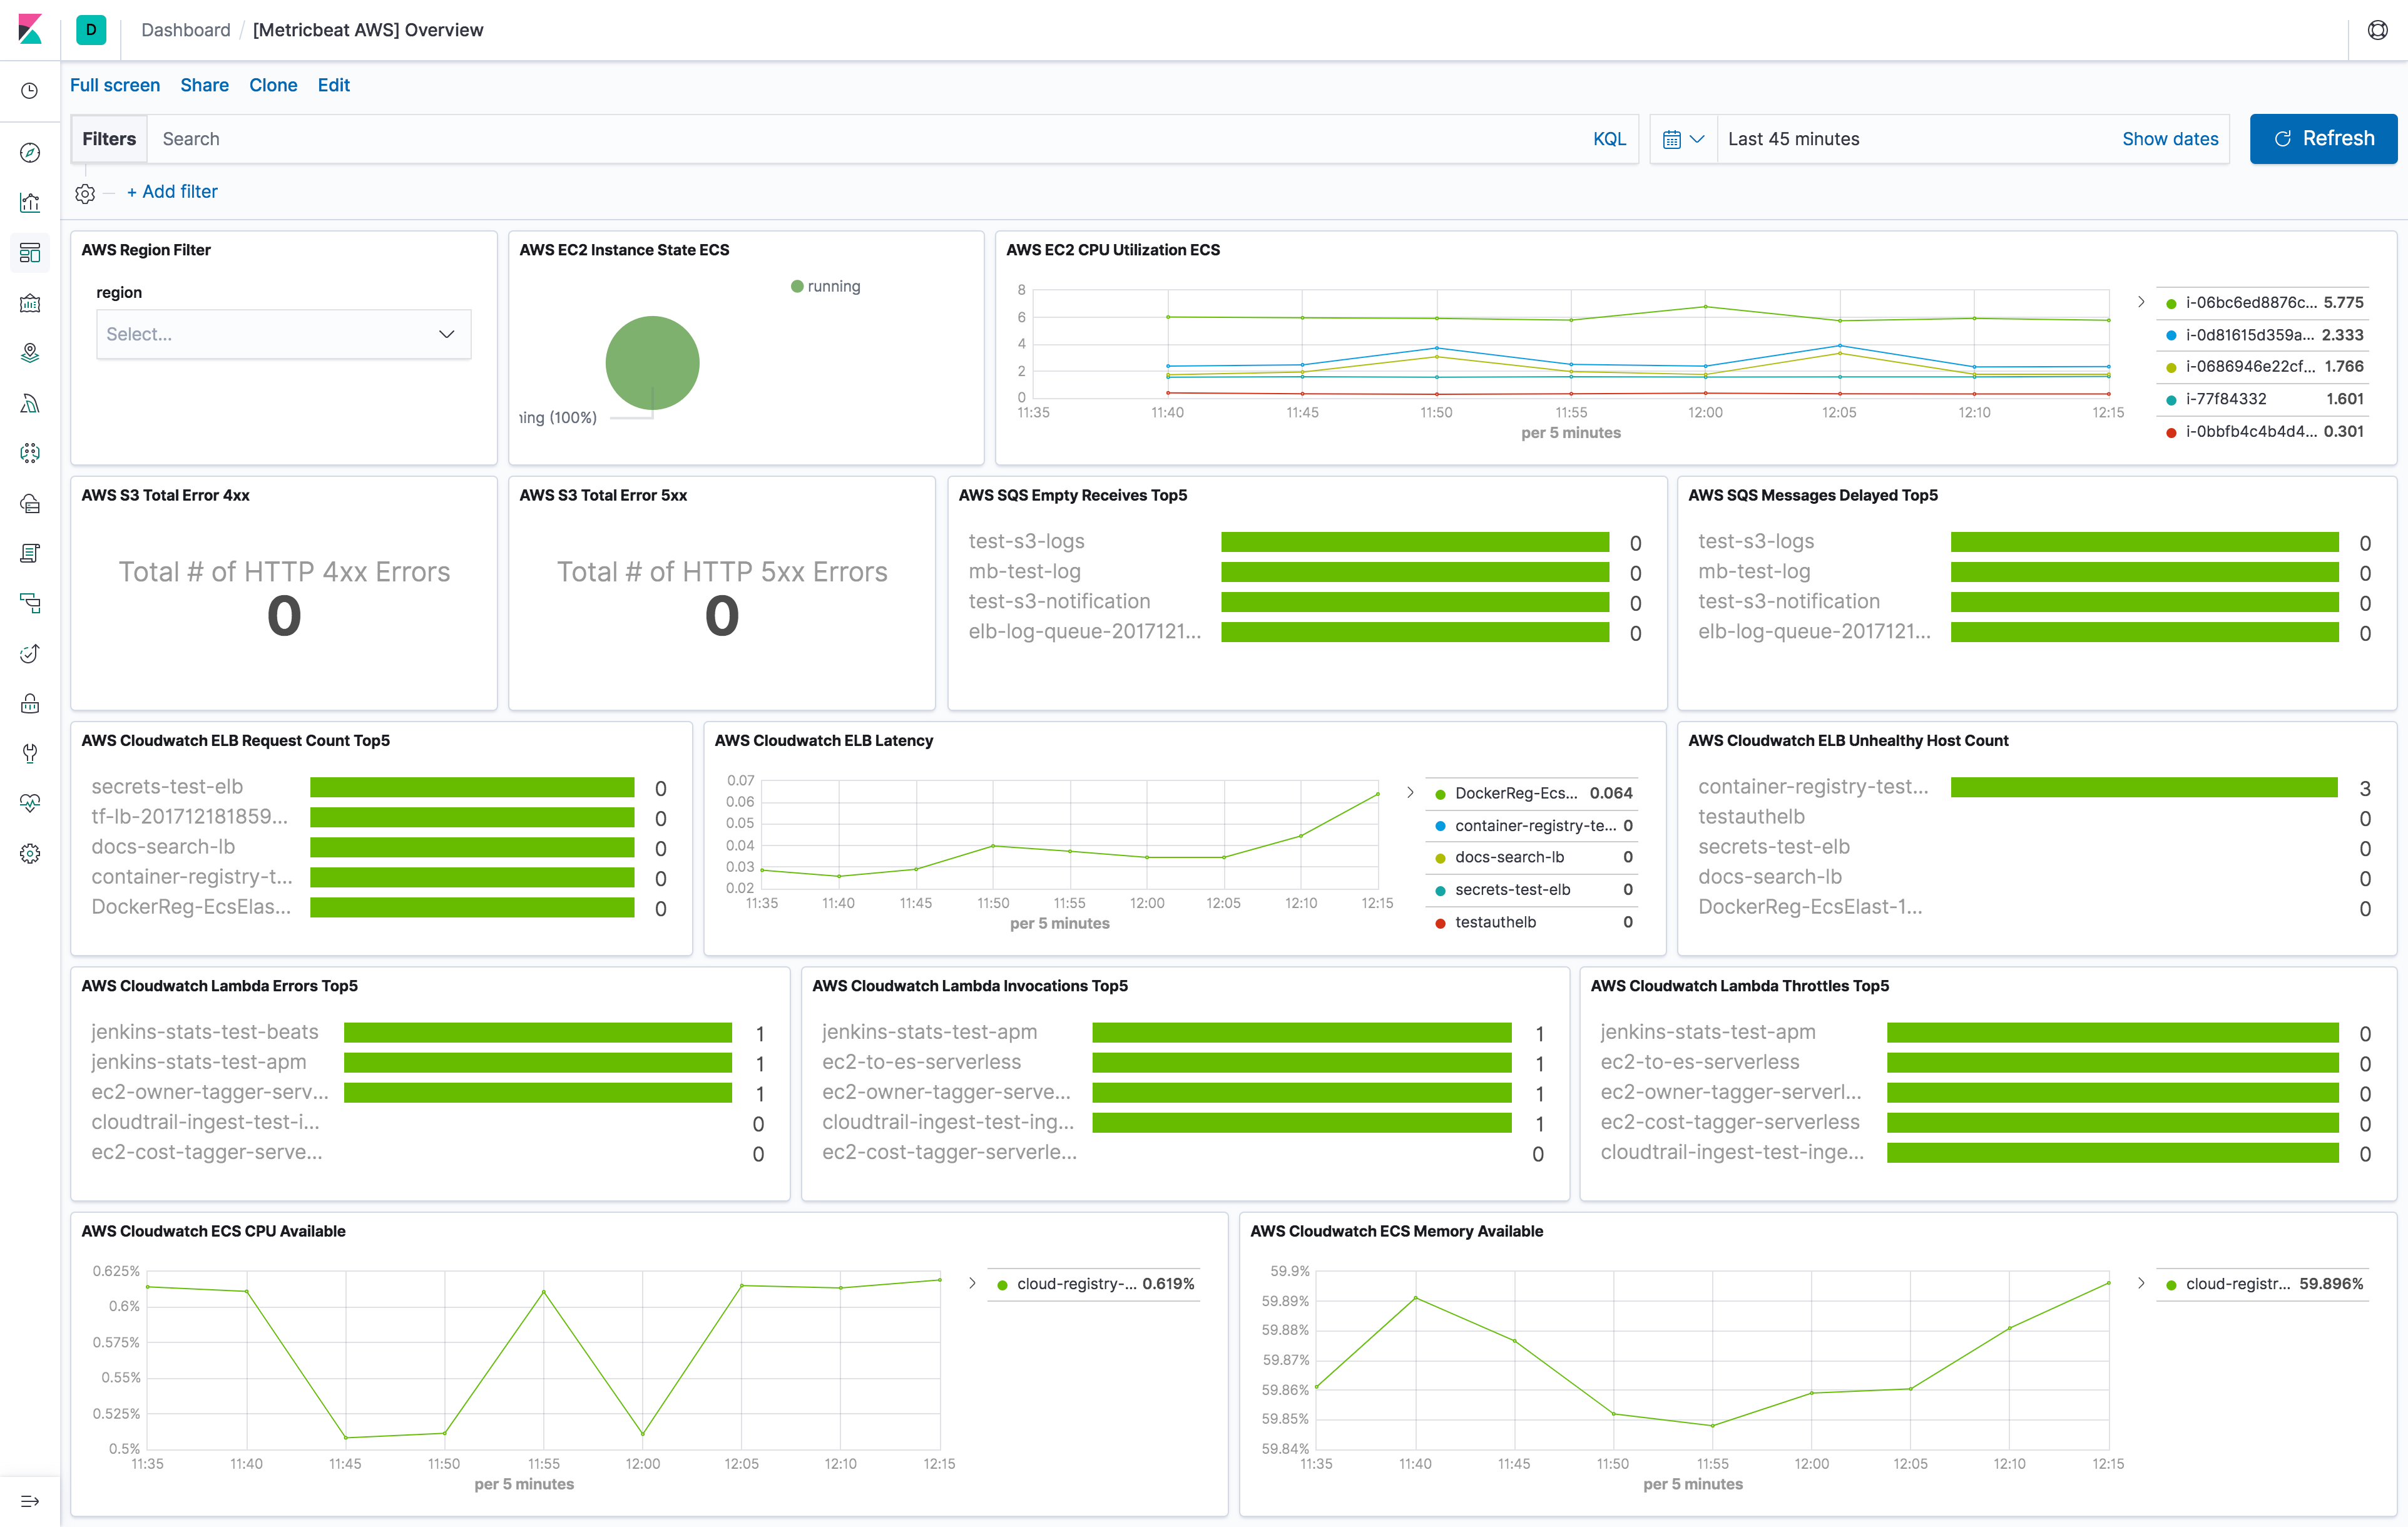
The aws module comes with a predefined dashboard. For example:
Metricsets
editCurrently, we have ec2, sqs, s3_request, s3_daily_storage and cloudwatch metricset in aws module. Collecting tags
for ec2 and cloudwatch metricset is supported.
- tags.: Tag key value pairs from aws resources. A tag is a label that user assigns to an AWS resource.
ec2
editBy default, Amazon EC2 sends metric data to CloudWatch every 5 minutes. With this basic monitoring, period in aws module
configuration should be larger or equal than 300s. If period is set to be less than 300s, the same cloudwatch metrics
will be collected more than once which will cause extra fees without getting more granular metrics. For example, in US East (N. Virginia) region, it costs
$0.01/1000 metrics requested using GetMetricData. Please see AWS Cloudwatch Pricing
for more details. To avoid unnecessary charges, period is preferred to be set to 300s or multiples of 300s, such as
600s and 900s. For more granular monitoring data you can enable detailed monitoring on the instance to get metrics every 1 minute. Please see
Enabling Detailed Monitoring for instructions
on how to enable detailed monitoring. With detailed monitoring enabled, period in aws module configuration can be any number
larger than 60s. Since AWS sends metric data to CloudWatch in 1-minute periods, setting metricbeat module period less
than 60s will cause extra API requests which means extra charges on AWS. To avoid unnecessary charges, period is
preferred to be set to 60s or multiples of 60s, such as 120s and 180s.
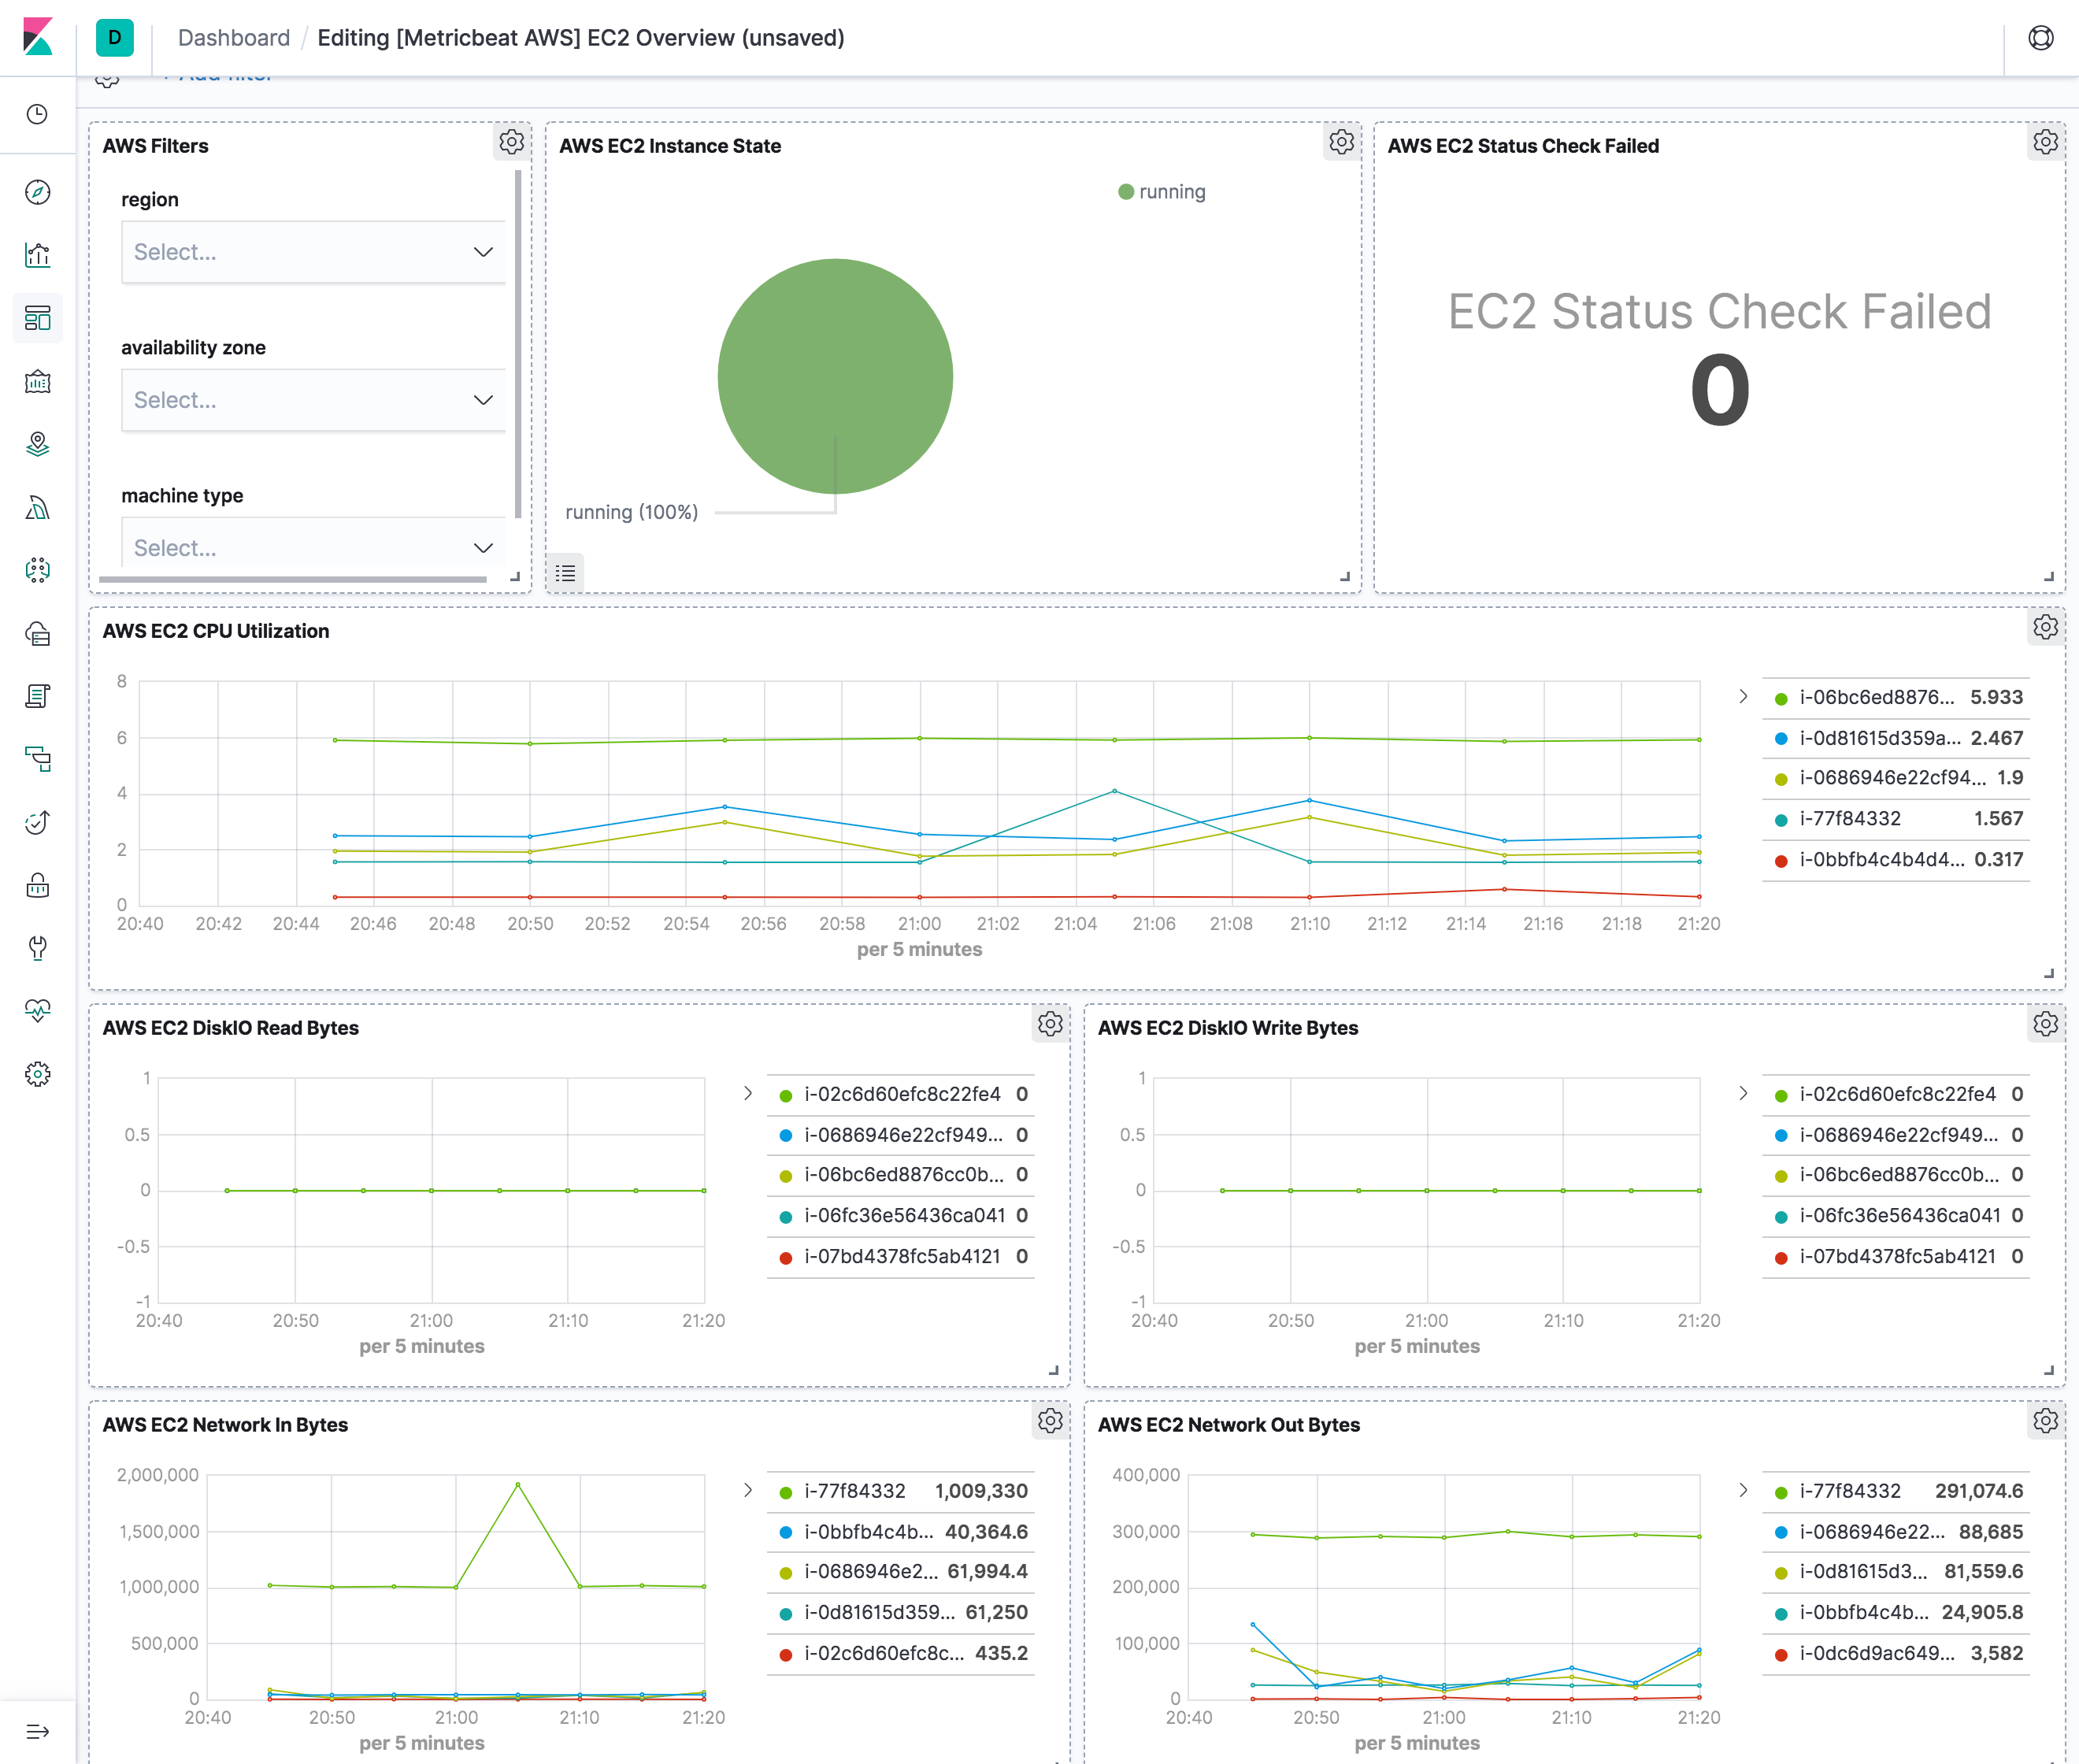
The ec2 metricset comes with a predefined dashboard. For example:
sqs
editCloudwatch metrics for Amazon SQS queues are automatically collected and pushed to CloudWatch every 5 minutes,
the period for sqs metricset is recommended to be 300s or multiples of 300s.
s3_daily_storage
editDaily storage metrics for S3 buckets are reported once per day with no additional cost. Since they are daily metrics,
period for s3_daily_storage metricset is recommended to be 86400s or multiples of 86400s.
s3_request
editRequest metrics are available
at 1-minute intervals with additional charges. The s3_request metricset will give more
granular data to track S3 bucket usage. The period for s3_request metricset can be set to 60s or multiples of 60s.
But because of the extra charges for querying these metrics, the period is recommended to set to 86400s. The user can
always adjust this to the granularity they want. Request metrics are not enabled by default for S3 buckets. Please see
How to
Configure Request Metrics for S3 for instructions on how to enable request metrics for
each S3 bucket.
cloudwatch
editThis metricset gives users the freedom to query metrics from AWS Cloudwatch with any given namespaces or specific instance with a given period. Please see AWS Services That Publish CloudWatch Metrics for a list of AWS services that publish metrics to CloudWatch.
rds
editperiod for rds metricset is recommended to be 60s or multiples of 60s because Amazon RDS sends metrics and
dimensions to Amazon CloudWatch every minute.
AWS Credentials Configuration
editTo configure AWS credentials, either put the credentials into the Metricbeat configuration, or use a shared credentials file, as shown in the following examples.
Supported Formats
edit-
Use
AWS_ACCESS_KEY_ID,AWS_SECRET_ACCESS_KEYand/orAWS_SESSION_TOKEN
Users can either put the credentials into metricbeat module configuration or use
environment variable AWS_ACCESS_KEY_ID, AWS_SECRET_ACCESS_KEY and/or
AWS_SESSION_TOKEN instead.
-
Use AWS credentials in Metricbeat configuration
metricbeat.modules:
- module: aws
  period: 300s
  metricsets:
    - ec2
  access_key_id: '<access_key_id>'
  secret_access_key: '<secret_access_key>'
  session_token: '<session_token>'
or
metricbeat.modules: - module: aws period: 300s metricsets: - ec2 access_key_id: '${AWS_ACCESS_KEY_ID:""}' secret_access_key: '${AWS_SECRET_ACCESS_KEY:""}' session_token: '${AWS_SESSION_TOKEN:""}' -
Use shared AWS credentials file
metricbeat.modules:
- module: aws
  period: 300s
  metricsets:
    - ec2
  credential_profile_name: test-mb
credential_profile_name is optional. If there is no credential_profile_name
given, the default profile will be used.
In Windows, shared credentials file is at C:\Users\<yourUserName>\.aws\credentials.
For Linux, macOS or Unix, the file is located at ~/.aws/credentials. Please see
Create Shared Credentials File
for more details.
AWS Credentials Types
editThere are two different types of AWS credentials can be used: access keys and temporary security credentials.
- Access keys
AWS_ACCESS_KEY_ID and AWS_SECRET_ACCESS_KEY are the two parts of access keys.
They are long-term credentials for an IAM user or the AWS account root user.
Please see
AWS Access Keys
and Secret Access Keys
for more details.
- Temporary security credentials
temporary security credentials has a limited lifetime and consists of an
access key ID, a secret access key, and a security token which typically returned
from GetSessionToken. MFA-enabled IAM users would need to submit an MFA code
while calling GetSessionToken. default_region identifies the AWS Region
whose servers you want to send your first API request to by default. This is
typically the Region closest to you, but it can be any Region. Please see
Temporary Security Credentials
for more details.
sts get-session-token AWS CLI can be used to generate temporary credentials. For example. with MFA-enabled:
aws> sts get-session-token --serial-number arn:aws:iam::1234:mfa/[email protected] --token-code 456789 --duration-seconds 129600
Because temporary security credentials are short term, after they expire, the user needs to generate new ones and modify the aws.yml config file with the new credentials. Unless live reloading feature is enabled for Metricbeat, the user needs to manually restart Metricbeat after updating the config file in order to continue collecting Cloudwatch metrics. This will cause data loss if the config file is not updated with new credentials before the old ones expire. For Metricbeat, we recommend users to use access keys in config file to enable aws module making AWS api calls without have to generate new temporary credentials and update the config frequently.
IAM policy is an entity that defines permissions to an object within your AWS environment. Specific permissions needs to be added into the IAM user’s policy to authorize Metricbeat to collect AWS monitoring metrics. Please see documentation under each metricset for required permissions.
Example configuration
editThe aws module supports the standard configuration options that are described in Specify which modules to run. Here is an example configuration:
metricbeat.modules:
- module: aws
  period: 300s
  metricsets:
    - ec2
  access_key_id: '${AWS_ACCESS_KEY_ID:""}'
  secret_access_key: '${AWS_SECRET_ACCESS_KEY:""}'
  session_token: '${AWS_SESSION_TOKEN:""}'
  default_region: '${AWS_REGION:us-west-1}'
- module: aws
  period: 300s
  metricsets:
    - sqs
  access_key_id: '${AWS_ACCESS_KEY_ID:""}'
  secret_access_key: '${AWS_SECRET_ACCESS_KEY:""}'
  session_token: '${AWS_SESSION_TOKEN:""}'
  default_region: '${AWS_REGION:us-west-1}'
  regions:
    - us-west-1
- module: aws
  period: 86400s
  metricsets:
    - s3_request
    - s3_daily_storage
  access_key_id: '${AWS_ACCESS_KEY_ID:""}'
  secret_access_key: '${AWS_SECRET_ACCESS_KEY:""}'
  session_token: '${AWS_SESSION_TOKEN:""}'
  default_region: '${AWS_REGION:us-west-1}'
- module: aws
  period: 300s
  metricsets:
    - cloudwatch
  access_key_id: '${AWS_ACCESS_KEY_ID:""}'
  secret_access_key: '${AWS_SECRET_ACCESS_KEY:""}'
  session_token: '${AWS_SESSION_TOKEN:""}'
  default_region: '${AWS_REGION:us-west-1}'
  cloudwatch_metrics:
    - namespace: AWS/EC2
      metricname: CPUUtilization
      dimensions:
        - name: InstanceId
          value: i-0686946e22cf9494a
    - namespace: AWS/EBS
    - namespace: AWS/ELB
      tags.resource_type_filter: elasticloadbalancing
- module: aws
  period: 60s
  metricsets:
    - rds
  access_key_id: '${AWS_ACCESS_KEY_ID:""}'
  secret_access_key: '${AWS_SECRET_ACCESS_KEY:""}'
  session_token: '${AWS_SESSION_TOKEN:""}'
  default_region: '${AWS_REGION:us-west-1}'
Metricsets
editThe following metricsets are available: