- Legacy APM Server Reference:
- Overview
- Get started
- Set up
- How-to guides
- Configure
- Secure
- Monitor
- API
- Explore data in Elasticsearch
- Exported fields
- APM Application Metrics fields
- APM Error fields
- APM Profile fields
- APM Sourcemap fields
- APM Span fields
- APM Span Metrics fields
- APM Transaction fields
- APM Transaction Metrics fields
- Beat fields
- Cloud provider metadata fields
- Docker fields
- ECS fields
- Host fields
- Kubernetes fields
- Process fields
- System Metrics fields
- Troubleshoot
- Upgrade
- Release notes
- APM Server version 7.15
- APM Server version 7.14
- APM Server version 7.13
- APM Server version 7.12
- APM Server version 7.11
- APM Server version 7.10
- APM Server version 7.9
- APM Server version 7.8
- APM Server version 7.7
- APM Server version 7.6
- APM Server version 7.5
- APM Server version 7.4
- APM Server version 7.3
- APM Server version 7.2
- APM Server version 7.1
- APM Server version 7.0
- APM Server version 6.8
- APM Server version 6.7
- APM Server version 6.6
- APM Server version 6.5
- APM Server version 6.4
- APM Server version 6.3
- APM Server version 6.2
- APM Server version 6.1
- APM integration (Elastic Agent)
Application performance monitoring (APM)
editApplication performance monitoring (APM)
editElastic APM is an application performance monitoring system built on the Elastic Stack. It allows you to monitor software services and applications in real time, by collecting detailed performance information on response time for incoming requests, database queries, calls to caches, external HTTP requests, and more. This makes it easy to pinpoint and fix performance problems quickly.
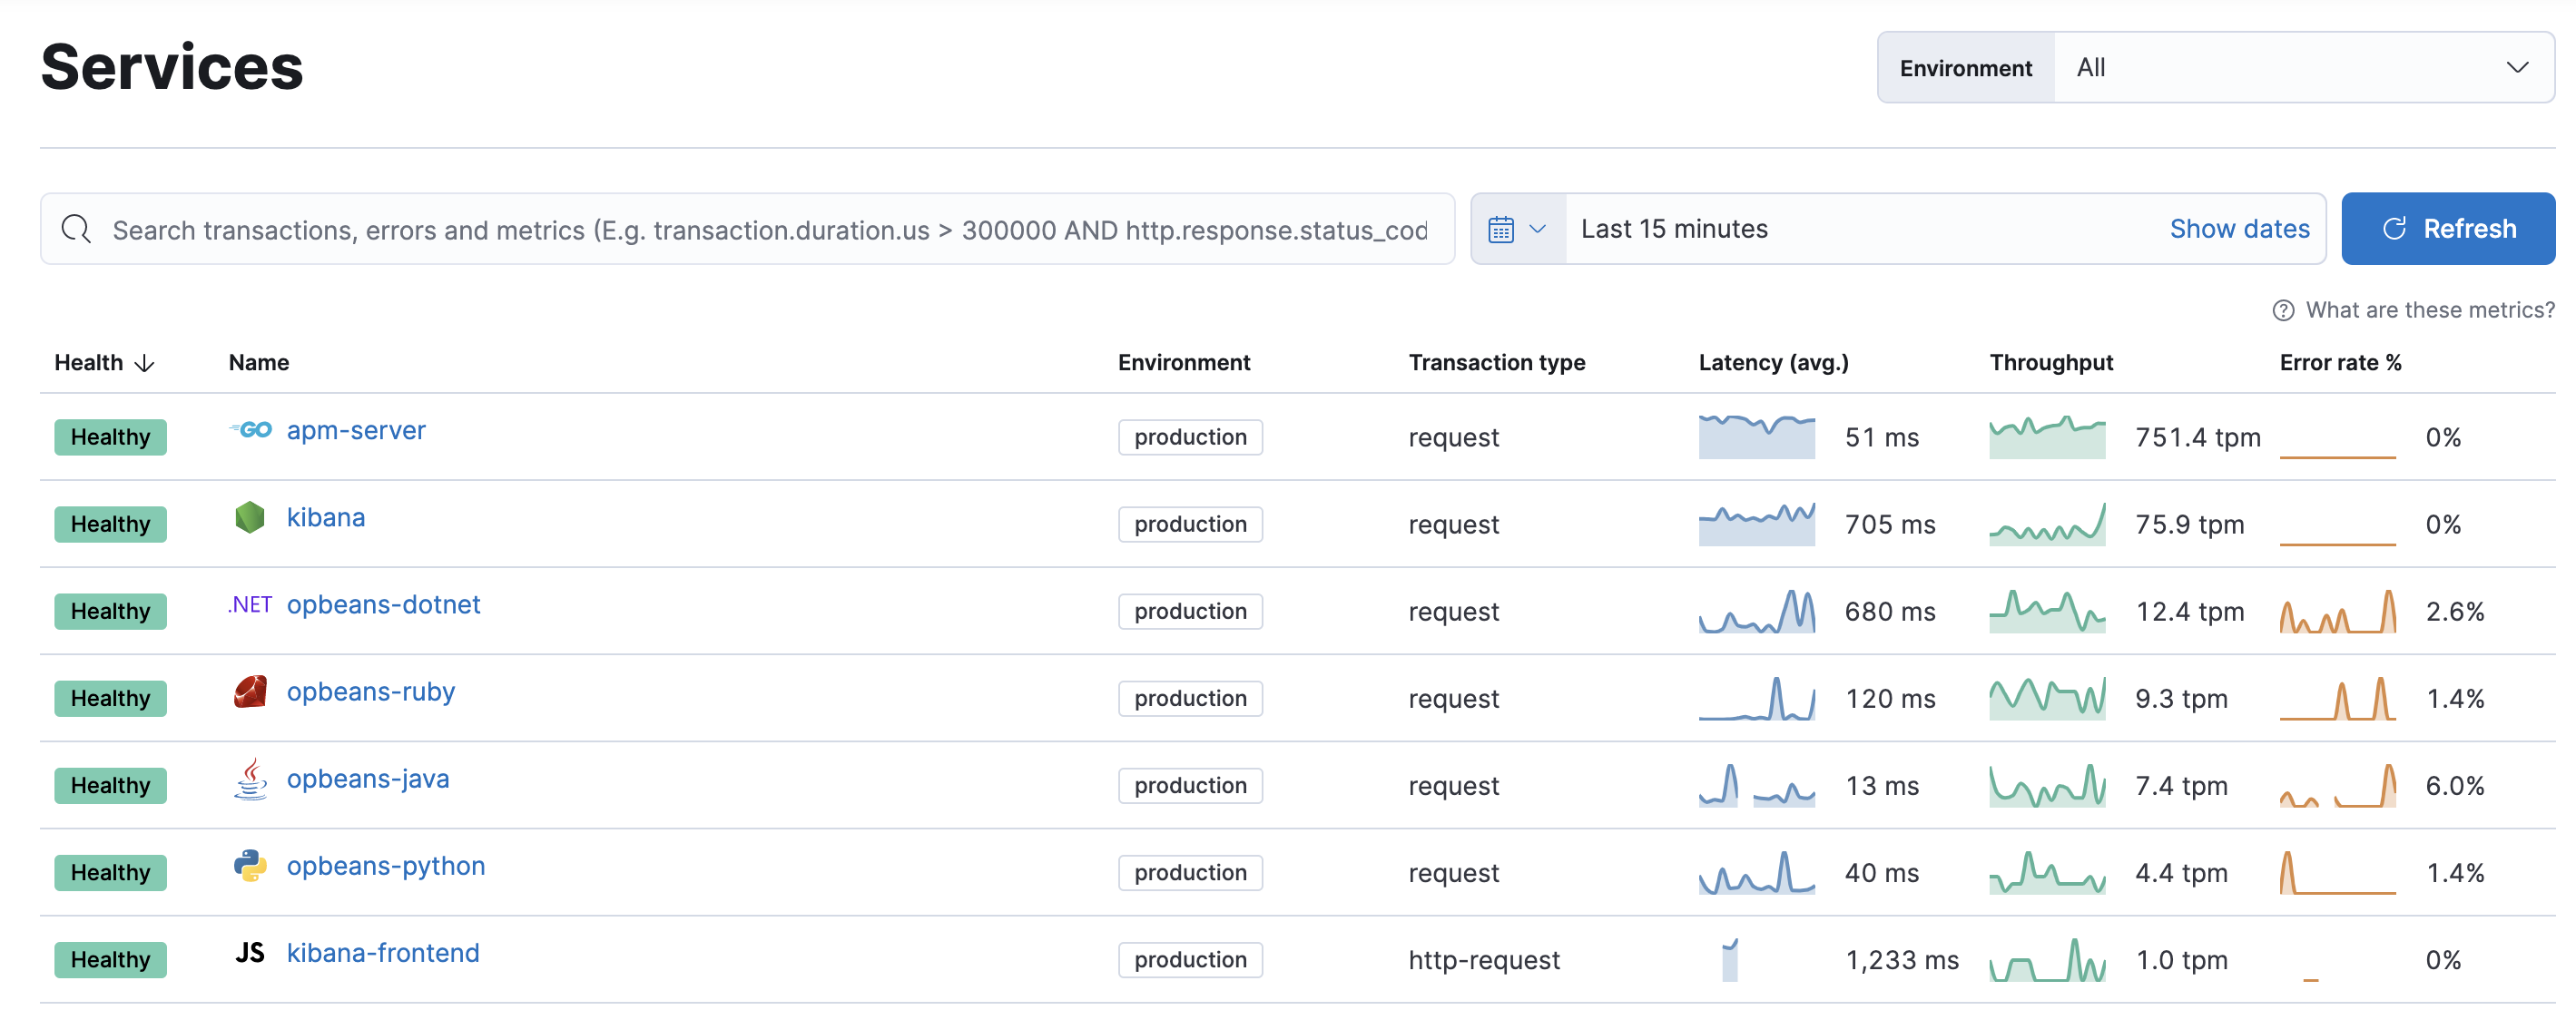
Elastic APM also automatically collects unhandled errors and exceptions. Errors are grouped based primarily on the stack trace, so you can identify new errors as they appear and keep an eye on how many times specific errors happen.
Metrics are another vital source of information when debugging production systems. Elastic APM agents automatically pick up basic host-level metrics and agent-specific metrics, like JVM metrics in the Java Agent, and Go runtime metrics in the Go Agent.
Give Elastic APM a try
editUse Get started with application traces and APM to quickly spin up an APM deployment. Want to host everything yourself instead? See Get started.
On this page