Uptime Monitoring with Heartbeat and the Elastic Stack
With the 6.5 release of the Elastic Stack, we are happy to announce the general availability of Heartbeat. Initially introduced in beta in January 2017, Heartbeat is a lightweight shipper — similar to the rest of our other Beats (Metricbeat, Filebeat, Winlogbeat, etc.) — but it's designed for uptime monitoring.
Heartbeat can operate from inside or outside of your network. All it needs is network access to the desired HTTP, TCP, or ICMP endpoint. Configuration is as simple as supplying Heartbeat with the list of URLs you want to monitor. Heartbeat executes periodic checks to verify whether the endpoint is up or down, then reports this information, along with other useful metrics, to Elasticsearch. This information is automatically displayed in pre-built Kibana dashboards for turnkey uptime monitoring.
Let's take a closer look at how to set up and use Heartbeat with the Elastic Stack.
Installing Heartbeat
To install Heartbeat, you will need to download and extract a pre-built executable for your platform. In this example, I will use macOS, however we support many other operating systems, so you should use the commands that work with your system.
Download and extract the latest version of Heartbeat:
curl -l -O https://artifacts.elastic.co/downloads/beats/heartbeat/heartbeat-6.5.0-darwin-x86_64.tar.gz
tar xzvf heartbeat-6.5.0-darwin-x86_64.tar.gz
Configuring Uptime Monitors
In order for Heartbeat to know which service to check, it needs a list of URLs. This configuration is specified the heartbeat.yml file under the /heartbeat folder. Here is an example for multiple HTTP checks with Heartbeat, which run every 10 seconds:
# Configure monitors
heartbeat.monitors:
- type: http
  # List or urls to query
  urls:
        - "https://www.elastic.co"
        - "https://discuss.elastic.co"
  # Configure task schedule
  schedule: '@every 10s'
In addition to the HTTP/S monitors, Heartbeat can perform TCP and ICMP checks so you can get better insight across different layers of your services. In Heartbeat we can also define additional layers of checks, for instance, with HTTP/S monitors we can check the response code, body and header. With TCP monitors we can define port checks and strings checks.
heartbeat.monitors:
- type: http
# List or urls to query
  urls: ["http://localhost:9200"]
  # request details:
  check.request:
       method: GET
  check.response:
       body: "You Know, for Search"
# Configure task schedule
  schedule: '@every 10s'
Here is an example for an HTTP body check, where Heartbeat is looking for the string “You Know, for Search” at http://localhost:9200 (the only URL specified in the config).
On all Heartbeat monitors, we can define additional parameters such as name, timeout and schedule. You can find complete configuration instructions on the Configuring Heartbeat documentation.
The final step in the configuration is to setup Heartbeat outputs (where to send the data to). Among the supported outputs are self-managed Elasticsearch cluster, Elastic Cloud, Logstash and more. In this example, I am sending Heartbeat data into my local Elasticsearch instance (“localhost:9200”):
output.elasticsearch:
# Array of hosts to connect to.
  hosts: ["localhost:9200"]
 # Optional protocol and basic auth credentials.
 #protocol: "https"
 username: "elastic"
  password: "changeme"
You can find an example file with the full configuration, in the heartbeat.reference.yml file.
Starting Heartbeat for the First Time
Heartbeat comes with prebuilt dashboards that provide a lot of value out of the box. Set up the dashboards and run Heartbeat using these commands:
To set up Heartbeat dashboards in Kibana: (optional, and only needs to be run once)
./heartbeat setup --dashboards
To run Heartbeat:
./heartbeat -e
As soon as Heartbeat starts to run, it will check the list of URLs you have configured, send back the information to the Elastic Stack, and pre-populate Kibana dashboards.
Visualizing Uptime Data in Kibana
When you open Kibana, you will see Heartbeat information in the Discover tab when you select the Heartbeat index (heartbeat-* by default):

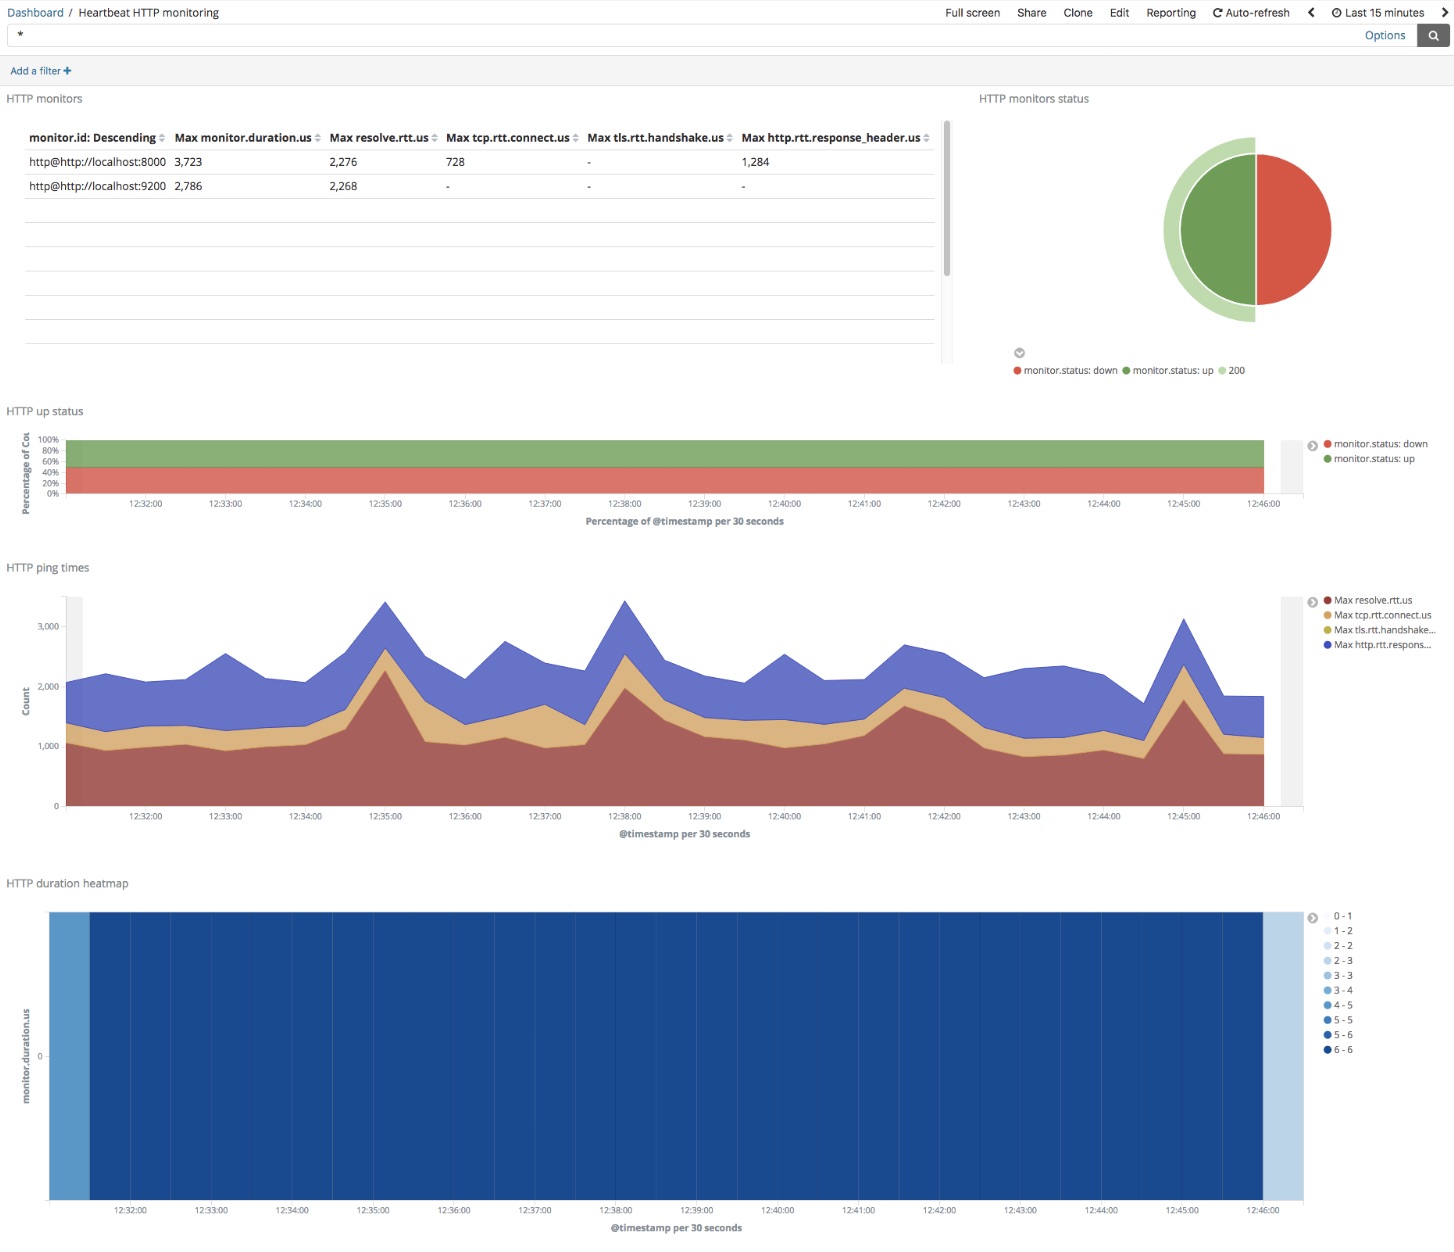
Among dashboards, you will find the “Heartbeat HTTP monitoring” dashboard that is populated with all of the information Heartbeat had sent:

This is the default Heartbeat dashboard:

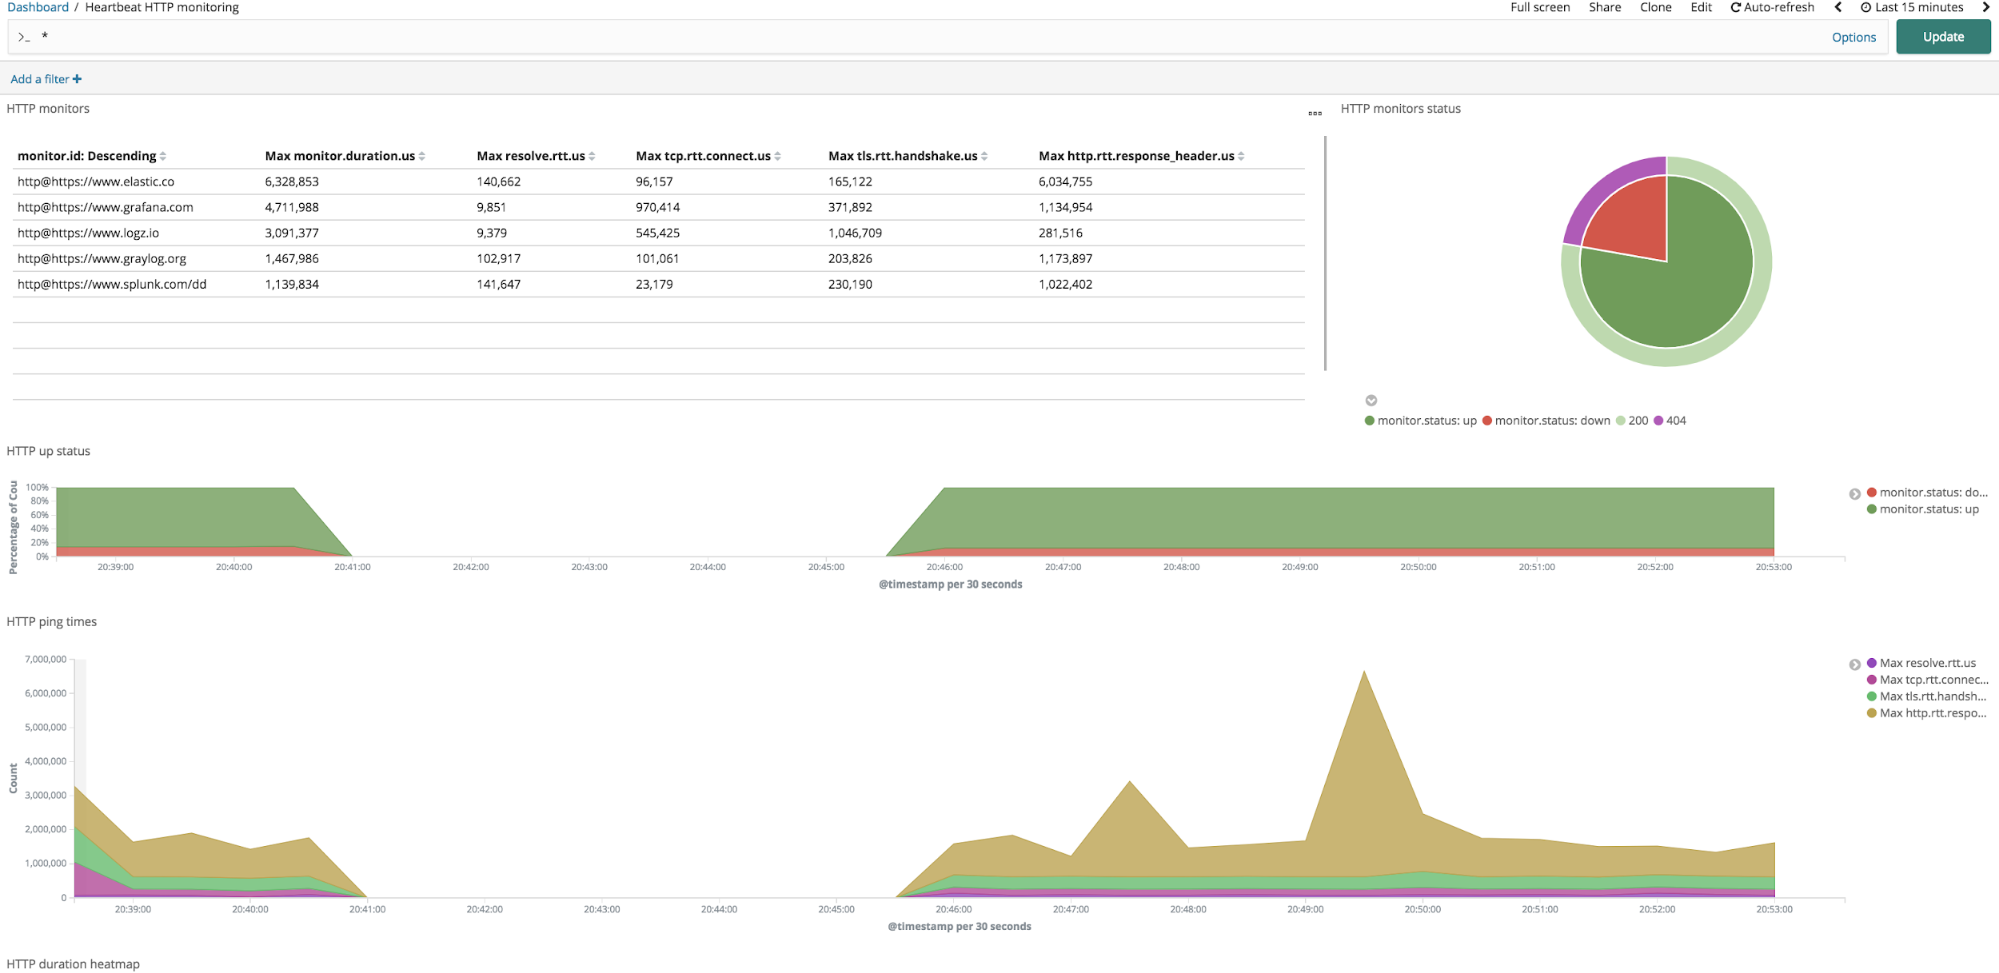
In the upper left corner you will see a table with a list of all Heartbeat-monitored endpoints, along with their response times. In the upper right, you will see the summary of the monitor status codes, and below it additional graphs which represent the percentage of monitors which are up or down, response time over time and number of checks over time.

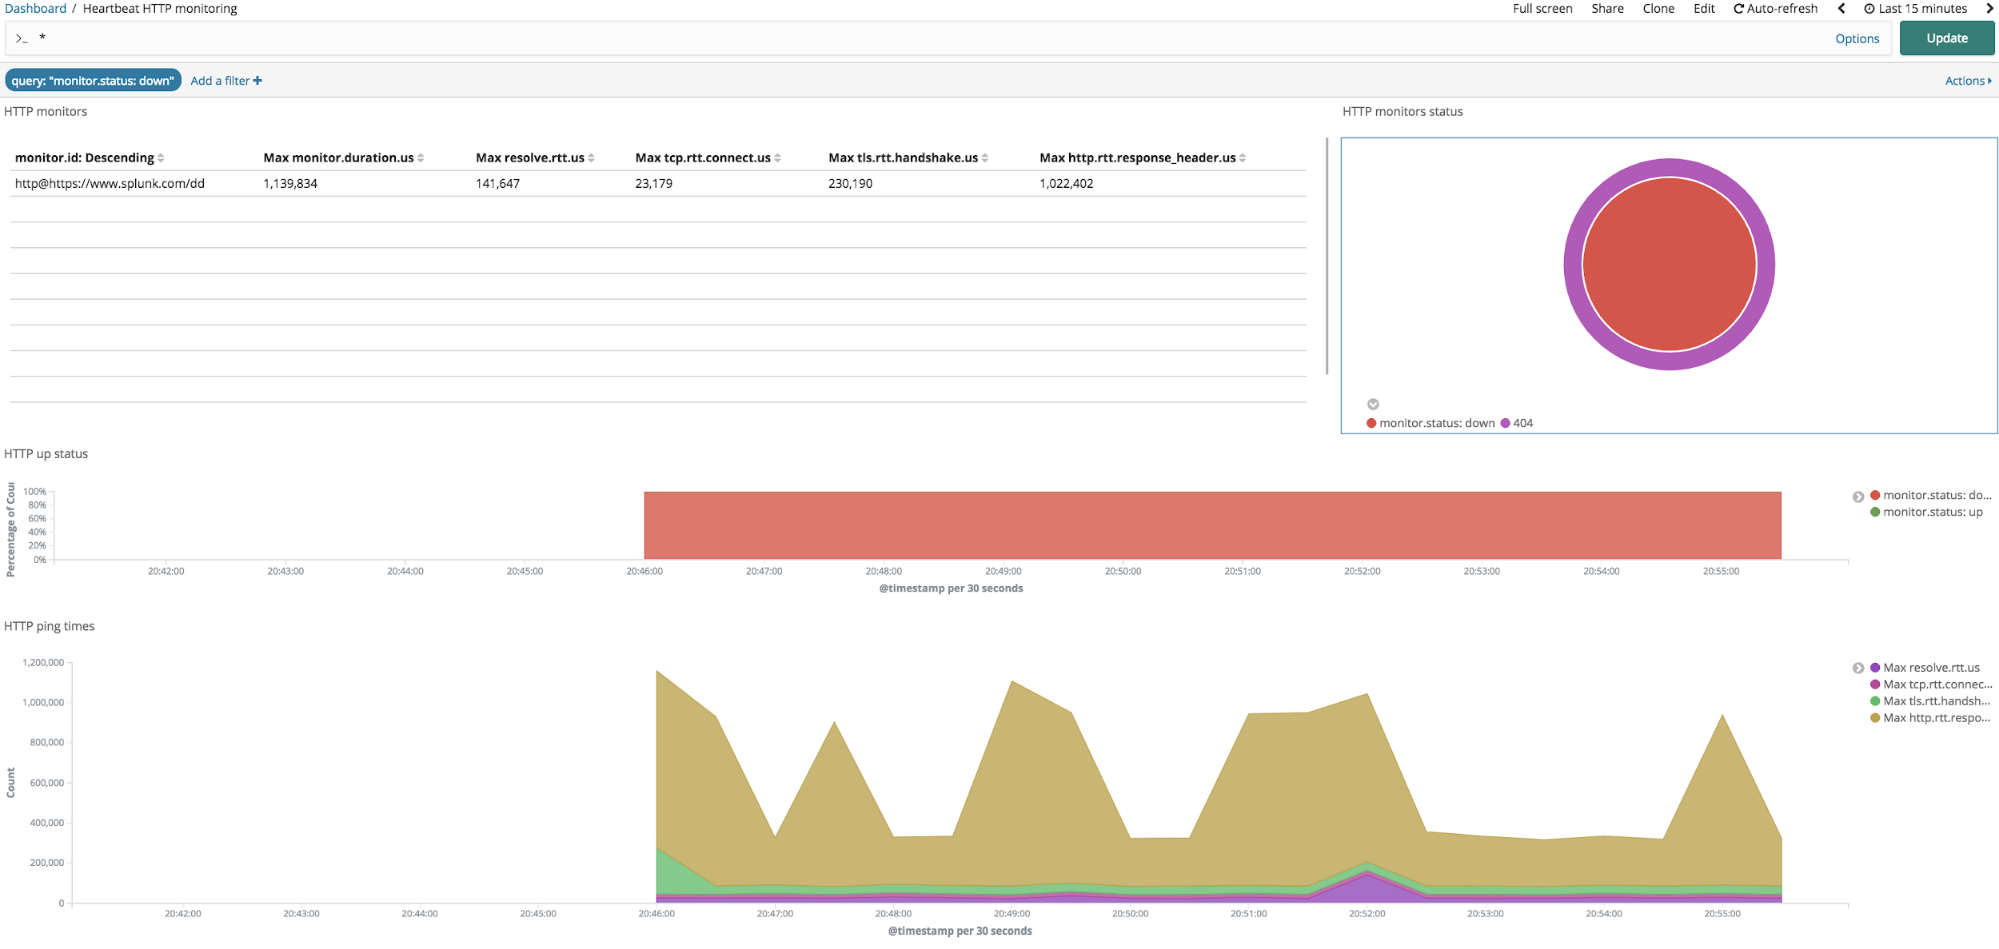
Heartbeat dashboards are interactive. With the default Heartbeat dashboard, you can easily detect if a specific endpoint is up or down, by clicking on the monitor down section (that is the red slice in the HTTP monitor status piechart located on the upper right corner). Clicking on it will apply a filter on the dashboard, which will display only the monitors which are down.

You can customize Heartbeat Kibana dashboards and visualizations in order to meet your needs. To get started with that, click the “Edit” button on the dashboard top right, click the gear on an individual visualization, and select “Edit Visualization”. You can also create new visualizations based on Heartbeat data, combine Heartbeat metrics with other log, metrics, and APM data sources, and add them to any operational dashboard you like.
Combining Heartbeat Data with Other Operational Data Sources
Combing Heartbeat data with additional data sources such as Metricbeat, Filebeat, and APM can provide important information when triaging an outage. Heartbeat will notify you when a specific service is down, Metricbeat and APM can provide you with the potential suspects, it can significantly improve the MTTR and will focus everyone to look at the right place, instead of playing the “blame game” in a typical war room.
Visit our solution page to learn more about our logging, metrics, and APM solutions.
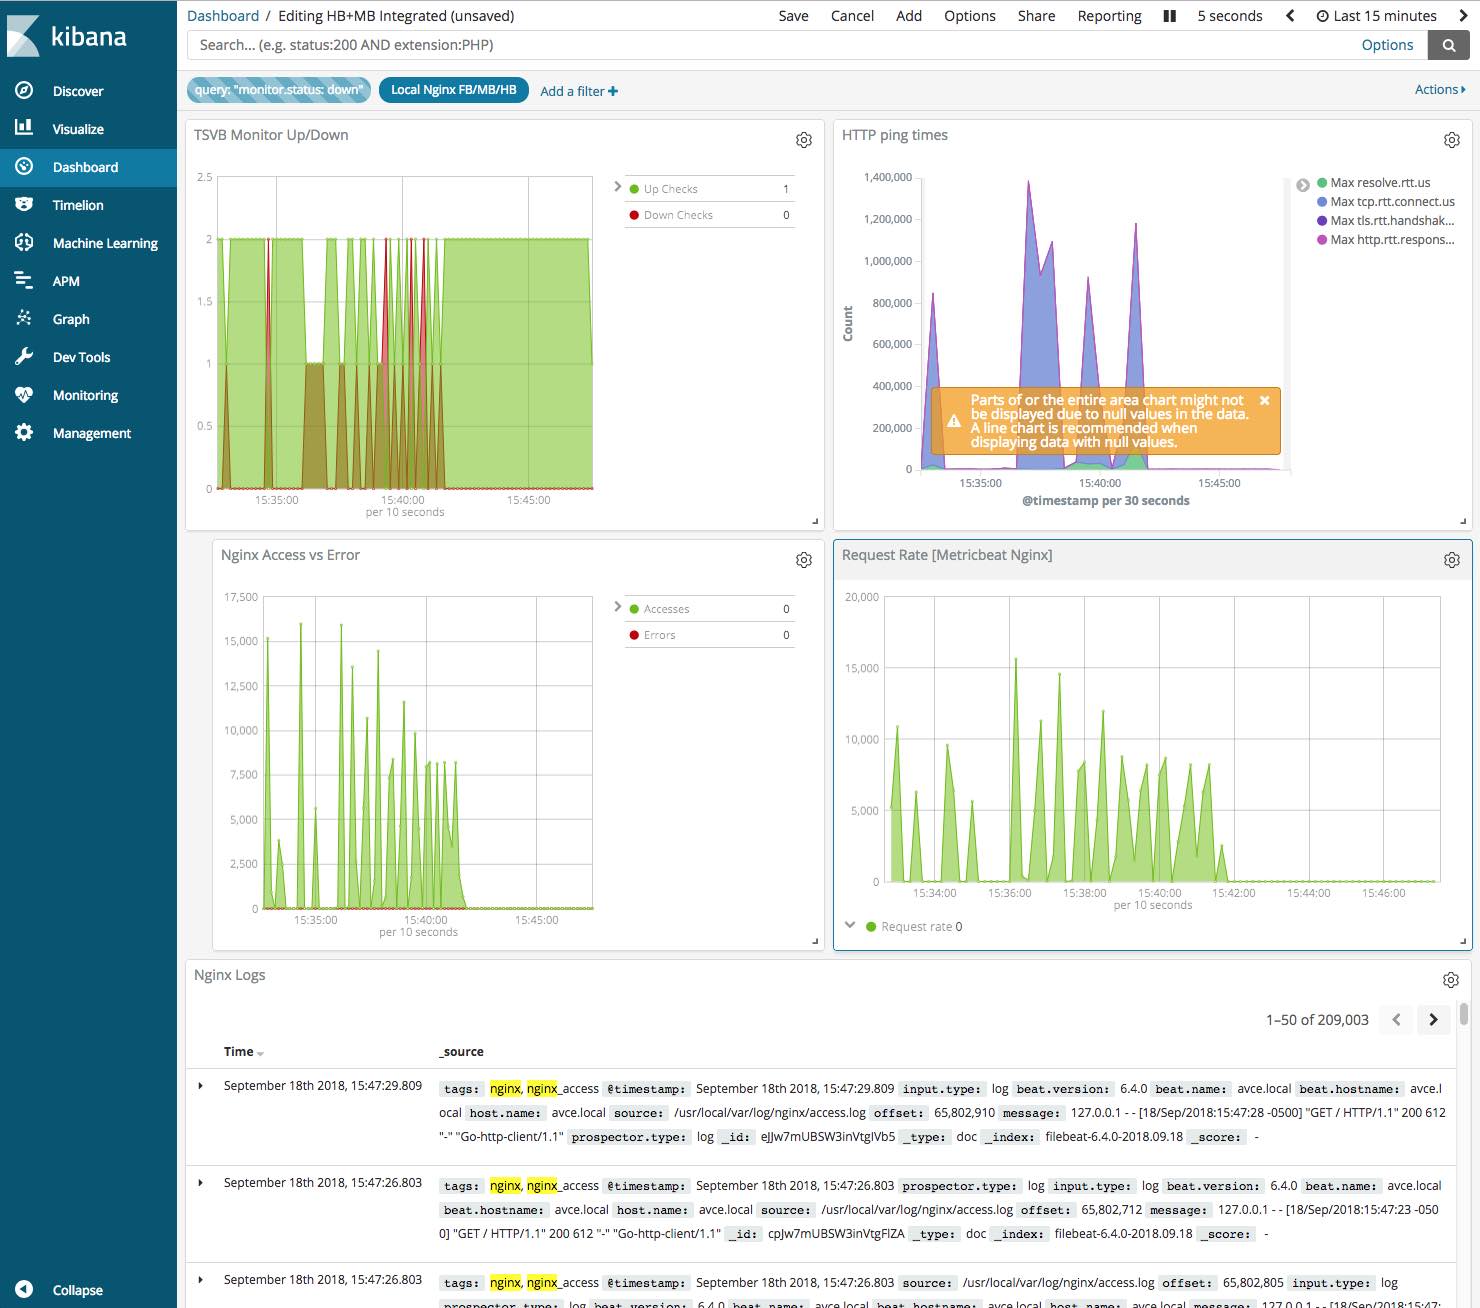
Here is an example for a Kibana dashboard which brings together metrics from Heartbeat (top two panels), and Metricbeat (bottom two panels).
- On the left hand side you can see that whenever Heartbeat detected that our endpoint is down, Metricbeat detects an increasing number of errors via the Nginx module.
- On the right hand side we can clearly see that whenever our HTTP ping time is increasing, Metricbeat detect high request rate in the NGINX server.
Observing this coincidence, we can conclude that a massive spike in request rate is triggering Nginx errors, which, in turn, is causing Heartbeat checks to fail:

Alerting and Anomaly Detection
You can use the alerting capabilities to get alerts and notifications on an outage or a performance degradation based on Heartbeat monitor data. You can also use the Elastic Stack machine learning capabilities to detect any anomalies based on time-series analytics of Heartbeat data. More on that in my next Heartbeat blog.
Summary
Monitoring can be a tough job. You need to identify, alert on, and resolve issues quickly. If today you are using multiple disparate tools to gain visibility across your applications and infrastructure, your task is likely even harder.
Heartbeat adds effective uptime monitoring functionality on top of existing logs, metrics, and APM features in the Elastic Stack. Use it by itself, or combine it with other valuable sources of operational data in Elasticsearch — so you won't miss a beat!
Heartbeat Resources
That’s it! Hope you found this overview useful. To get started, download Heartbeat and read its documentation for more in-depth coverage of the functionality. One of the fastest ways to experience Heartbeat is to ship your uptime data to the Elasticsearch Service on Elastic Cloud — the hosted Elasticsearch and Kibana offering from the creators of these projects.
If you have questions, please engage with us on the Heartbeat Discuss forum, and if you find any issues or would like to file an enhancement request, please do so in Github.