Elasticsearch 7.8.0 released
We are pleased to announce the release of Elasticsearch 7.8.0, based on Lucene 8.5.1. Version 7.8 is the latest stable release of Elasticsearch, and is now available for download or deployment via Elasticsearch Service on Elastic Cloud.
If you're ready to roll up your sleeves and get started, we have the links you need:
- Start Elasticsearch on Elastic Cloud
- Download Elasticsearch
- Elasticsearch 7.8.0 release notes
- Elasticsearch 7.8.0 breaking changes
While this blog covers the most notable new and enhanced Elasticsearch features, it’s important to remember that our Enterprise Search, Observability, and Security solutions also received significant updates as well. To learn more about these updates, you might consider giving our other release blogs a read.
Unleash aggregations on your data
Beneath the surface of Elasticsearch is a powerful analytics engine, waiting to be unleashed on your data. Elasticsearch aggregations fuel this engine and enable users to easily extract metadata from their search results.
As a core part of the Elastic Stack’s foundational infrastructure, all new and enhanced aggregation capabilities add value to each of three of our primary solutions.
For example, when we introduced the rare_terms aggregation with Elasticsearch 7.3, we not only helped thousands of Elastic Observability users easily pinpoint which user was responsible for a disproportionate share of network traffic, but we also helped thousands of SIEM users identify rare events that might be indicative of malicious behavior.
Enhanced geospatial aggregations
Today's location-based services and applications require real-time analysis of geospatial data. Whether you're protecting your network from attackers, investigating slow application response times in specific locations, or simply hailing a ride home, geo data (and search) play an important role.
The Elastic Stack makes it easy to index and store all kinds of location data — from geopoints to geoshapes like polygons, circles, lines, multi-lines, and boxes. And, with built-in applications like Elastic Maps, you can visually explore and analyze your geospatial data without the need for additional tools.
The release of 7.8 strengthens the Elastic Stack’s geospatial capabilities by enhancing the following aggregations to support BKD-backed geo_shapes:
- geo_bounds (which calculates a rectangle that contains a set of points or shapes)
- geotile_grid and geohash_grid (which count the number of points or shapes per tile)
- geo_centroid (which calculates the center point of multiple points or shapes)
With these enhancements it becomes much easier to use shapes for geospatial analytics in Elasticsearch. We anticipate that most users will no longer need to write custom code to perform common geospatial aggregations when working with shapes.

For example, the enhanced geo_bounds aggregation makes it easy to present a map showing all relevant shapes and the geotile_grid and geohash_grid aggregations make it easy to color maps based on shape density per map tile.
Ready to get started? All of these enhanced aggregations are immediately available for use in Kibana via Elastic Maps. Learn more about today’s enhancements to Elastic Maps in the Kibana 7.8 release blog.
New aggregations on histogram
Monitoring application performance? This news is for you.
The histogram datatype is designed to contain the result of... wait for it... a histogram (!), and, to that end, contains both an array of doubles where each double signifies a bucket and an array of integers where each integer signifies the number of incidents within the bucket to which it corresponds. A histogram is essentially a statistical representation of data (count per value) and is most frequently used to provide a succinct representation of data.
Elasticsearch 7.8 introduces support for three new aggregations on the histogram field:
- Sum (which provides the sum of each value multiplied by the number of cases, summed for all the histograms)
- ValueCount (which sums the number of cases in all histograms)
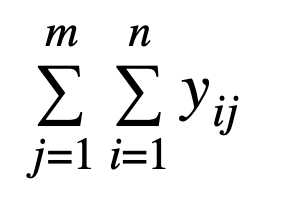
- Average (which is a weighted average calculated as Sum divided by ValueCount)
And, for those who enjoy the language of mathematics: let n be the number of values in the histogram and m be the number of histograms, xij be the value of bucket i in histogram j and yij be the count of incidents in bucket i in histogram j.
- Sum:

- ValueCount:

- Average:

All you need to remember is that the histogram datatype provides Elasticsearch users with an efficient and easy option for saving numeric measurements (e.g., it’s incredibly useful in APM use cases). And, the ability to analyze data stored as histograms through additional aggregations means it can be used in additional scenarios.
New t-test metrics aggregation
Remember everything from your college statistics class? Yea… we didn’t think so. But here’s one thing that might be useful to dredge back up: Student’s t-test. In practice, Student’s t-test tells you whether the difference between two population means are statistically significant, or if the difference occurred by chance alone.
With Elasticsearch 7.8 we’re introducing a t-test metrics aggregation.
Why is this useful? Consider the following observability scenario: you’re performing operating system upgrades in your datacenter and want to know if there’s any performance impact per node or per server. You measure parameters before and after the upgrade and run everything through the new t-test metrics aggregation. Problem solved, question answered. Another common use case is A/B testing marketing assets, such as webpages or emails. The new t-test metrics aggregation makes it easy to know if your new marketing copy is actually getting a statistically higher click-through-rate or if it’s just chance.
Reduced aggregation memory consumption
Rounding out the aggregation news for Elasticsearch 7.8 is something that should sound familiar: reduced memory consumption. With 7.8, when using asynchronous search or operating in environments with more than 512 shards, we’ve reduced aggregation memory consumption by maintaining serialized results for as long as possible (since serialized results require much less memory than deserialized sets).
Reducing memory consumption should sound familiar because across the board, whether for aggregations or elsewhere, we’re always working to optimize the performance of Elasticsearch.
Ingest made (even) easier
One of the best ways to get more value out of the Elastic Stack is to find ways to more easily get information into the Elastic Stack. Without your data, the Elastic Stack is “all theory” and “zero practice.” If you’ve been paying attention over the last few years you know that Elasticsearch ingest nodes, ingest processors (like the enrich processor we introduced with Elasticsearch 7.5), and custom ingest pipelines are extraordinarily powerful.
Whether you’re monitoring infrastructure data or hunting for threats, our goal is to make it as easy as possible to get your data into Elasticsearch. With the release of Elasticsearch 7.8 we’re not only introducing an Ingest Manager to help with sending data into Elasticsearch, but we’re also introducing an ingest node pipeline builder to make it easy to configure custom ingest pipelines that extract fields, enrich your data, and more.
The ingest node pipeline builder enables users to view all of their ingest pipelines in a single table. Users can create, delete, and edit pipelines using a JSON editor. Thanks to the new graphical user interface, users can more easily test how a given ingest pipeline and its various ingest processors transform data and documents before putting it into production. We anticipate this will save users lots of valuable configuration time.
Upload 10x larger files into the Elastic Stack
Speaking of ingesting data, in 7.8 we have added the ability to edit the upload limit for the file data visualizer from 100 MB to 1 GB. Combine this with the 7.7 enhancement for the file data visualizer to recommend a filebeat config to streamline uploading files structured in the same way, and you’ve got a recipe for ingesting large files much faster. Equally exciting though, is the file data visualizer’s new ability to generate an analysis explanation of how it successfully or unsuccessfully was able to map data fields as part of the upload process. This new feature is invaluable if you are just getting started uploading files into the Elastic Stack and want to understand why the file uploader isn’t able to successfully ingest your data due to something like an unsupported date format. Whether you’re trying to bring in more data to support training machine learning models or just loading sample data, we’re making moving data into the Elastic Stack even easier.
Transforming your data for better analytics
Being able to shape data and alter its level of granularity is an important capability for data analytics since it can impact everything from storage to the level of insight you can glean. From security analytics to logs investigation to machine learning model training, manipulating data aggregation and orientation is key. We’ve made it easy and scalable to house, search, and analyze vast amounts of data while giving you the option to complete powerful data summarizations and pivots by performing transforms directly from within Kibana.
The ability to perform transforms became generally available with the release of Elastic Stack 7.7, but that doesn’t mean we’ve slowed down the innovation. In 7.8, the interface for building transforms has been updated to provide you with a more flexible layout for rapidly building and previewing the results of transformed data.
In addition, you can define a rate at which to perform search and index requests. This gives you the flexibility to control the impact the transforms process has from a resource perspective on your Elasticsearch cluster.
That's not all, folks...
There are many more new features included in Elasticsearch 7.8 (e.g. deleting multiple snapshots with a single command and adding multiple values to the keystore with a single command). Be sure to check out the release highlights and the release notes for additional information.
Ready to get your hands dirty? Spin up a 14-day free trial on Elastic Cloud or download Elasticsearch today. Try it out. And be sure to let us know what you think on Twitter (@elastic) or in our forum. You can report any problems on the GitHub issues page.