Optimizing cloud resource costs with Elastic Observability and Tines

In today's cloud-centric landscape, managing and optimizing cloud resources efficiently is paramount for cloud engineers striving to balance performance and cost-effectiveness. By leveraging solutions like Tines and Elastic, cloud engineering teams can streamline operations and drive significant cost savings while maintaining optimal performance.
In the first half of this blog post, we'll explore how the integration of these platforms can empower cloud engineers to maximize resource utilization and minimize expenses. In the second half we will show how to integrate these platforms to provide a unified solution to improve cloud cost optimization.
Harnessing the power of Observability with Elastic
Elastic Observability offers cloud engineers and site reliability engineers a comprehensive suite of tools for monitoring and analyzing the performance of cloud infrastructure and applications. From metrics monitoring to log analysis, Elastic provides real-time insights into resource usage, performance bottlenecks, and potential areas for optimization. By leveraging Elastic's rich data visualization and analytics capabilities, cloud engineers gain deep visibility into their cloud environments, enabling informed decision-making to drive efficiency and cost savings.
Workflow automation with Tines
Tines is the smart and secure workflow builder purpose-built to empower technical teams. With Tines, you can build and automate mission-critical workflows, ensuring transparent collaboration across teams and systems. Tines seamlessly integrates with your existing tools and platforms, allowing you to connect the dots effortlessly — whether it’s APIs, databases, or custom scripts — without requiring complex coding. Additionally, Tines’ robust case management system ensures that incidents, alerts, and tasks are handled efficiently and freeform to match an organization's needs. Track, prioritize, and resolve issues with precision, all within a single unified interface.
Optimizing resource utilization
One of the key challenges for cloud engineering teams is ensuring that resources are utilized optimally to avoid unnecessary costs. Elastic Observability provides cloud engineers with insights into resource usage patterns, enabling them to identify underutilized resources, overprovisioned workloads, and inefficient configurations. By leveraging this data, engineers can make informed decisions to rightsize resources, adjust configurations, and implement cost-saving measures without compromising performance.
Better together: Driving cost savings through workflows
By integrating Tines and Elastic, teams can build cost optimization workflows based on real-time insights. For example, engineers can create workflows to:
Scale resources dynamically, based on demand
Schedule non-production instances to shut down during off-peak hours
Implement cost allocation policies to track and optimize spending across departments or teams
By implementing these cost-saving workflows, organizations can significantly reduce cloud infrastructure costs while maintaining the desired level of performance and reliability.
How it works: Integrating Elastic Observability with Tines
This following section details how to integrate Tines with Elastic Observability to automatically detect and take remedial action when CPU resource utilization exceeds a certain threshold for a period of time.
1. Log in to your Tines Tenant at tines.com. If you don’t currently have a Tines Tenant, you can sign up for one by selecting Sign up*.

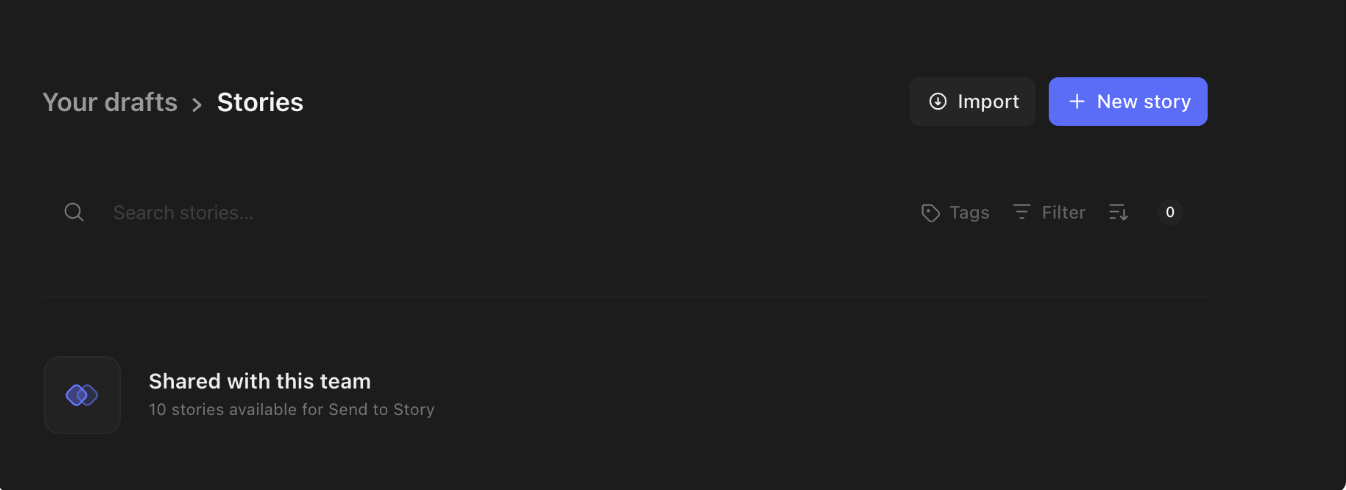
2. Once logged in, select “Your Drafts,” and then click on + New story.
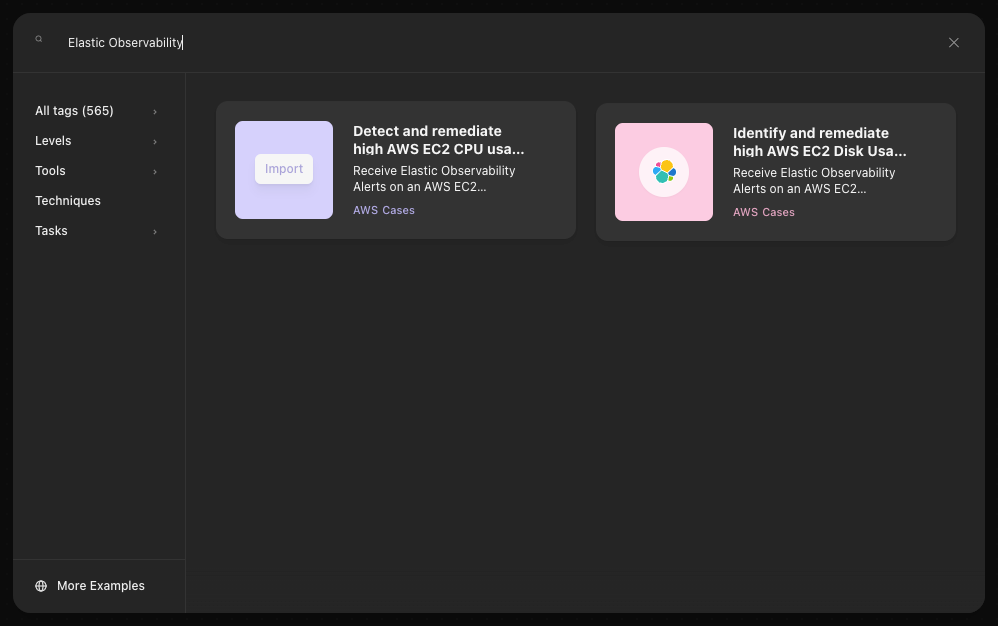
3. After you enter the playbook editor of Tines, select “Story Library.” Search for “Elastic Observability” to find the Elastic Observability Stories. Hover over the story of your choice and click Import. We selected “Detect and remediate high AWS EC2 CPU usage with Elastic Observability and document with Tines cases” in this example.
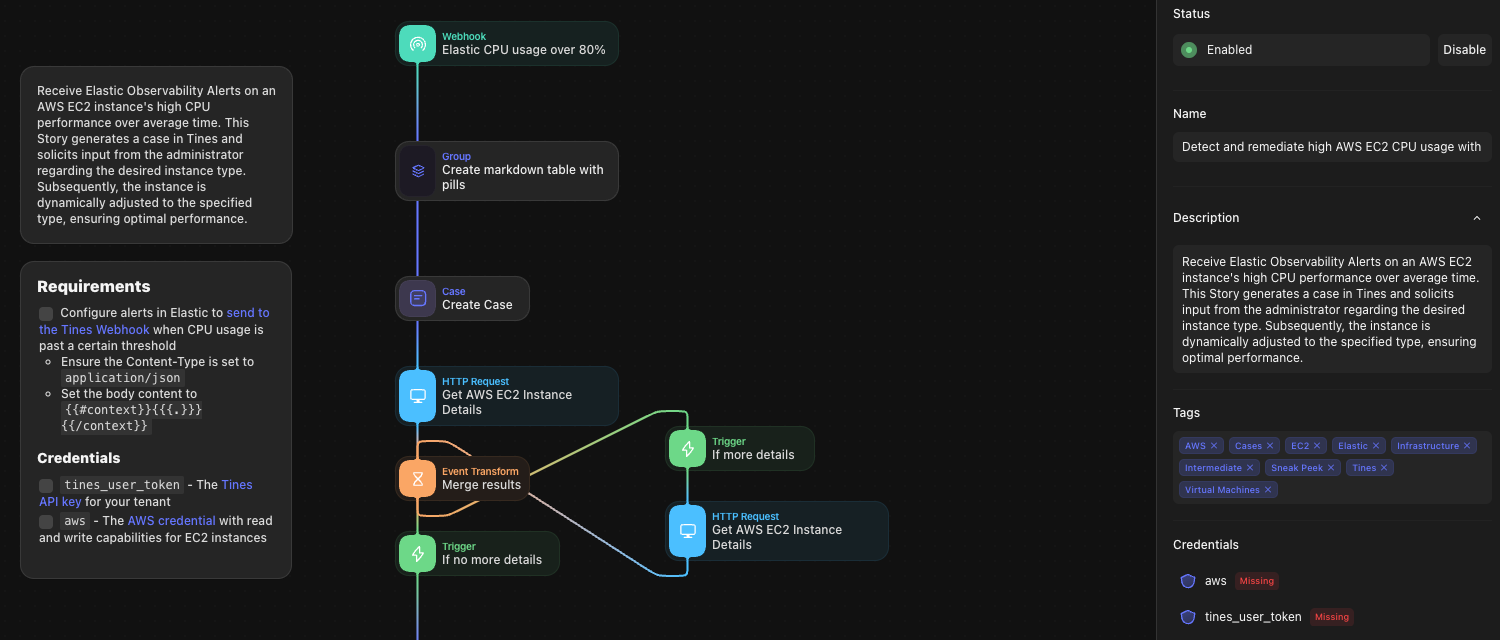
4. Once the story has been imported, you will need to configure credentials for the target AWS organization/account and Tines tenant API:
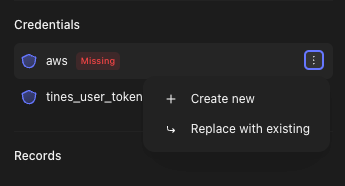
Using the three dots to the right of these credentials, you can quickly and easily Create new credentials or Replace with existing ones.
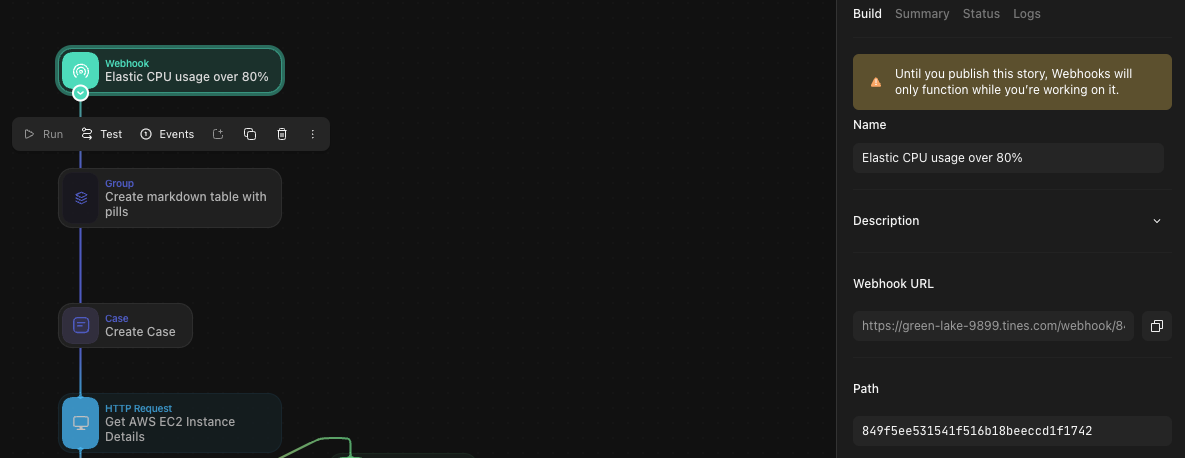
Finally, click on the Webhook action block and copy the “Webhook URL.” You will use this later when configuring an alert in Elastic Observability.
5. Log in to your Elastic Cloud account at cloud.elastic.co/login or sign up for one.
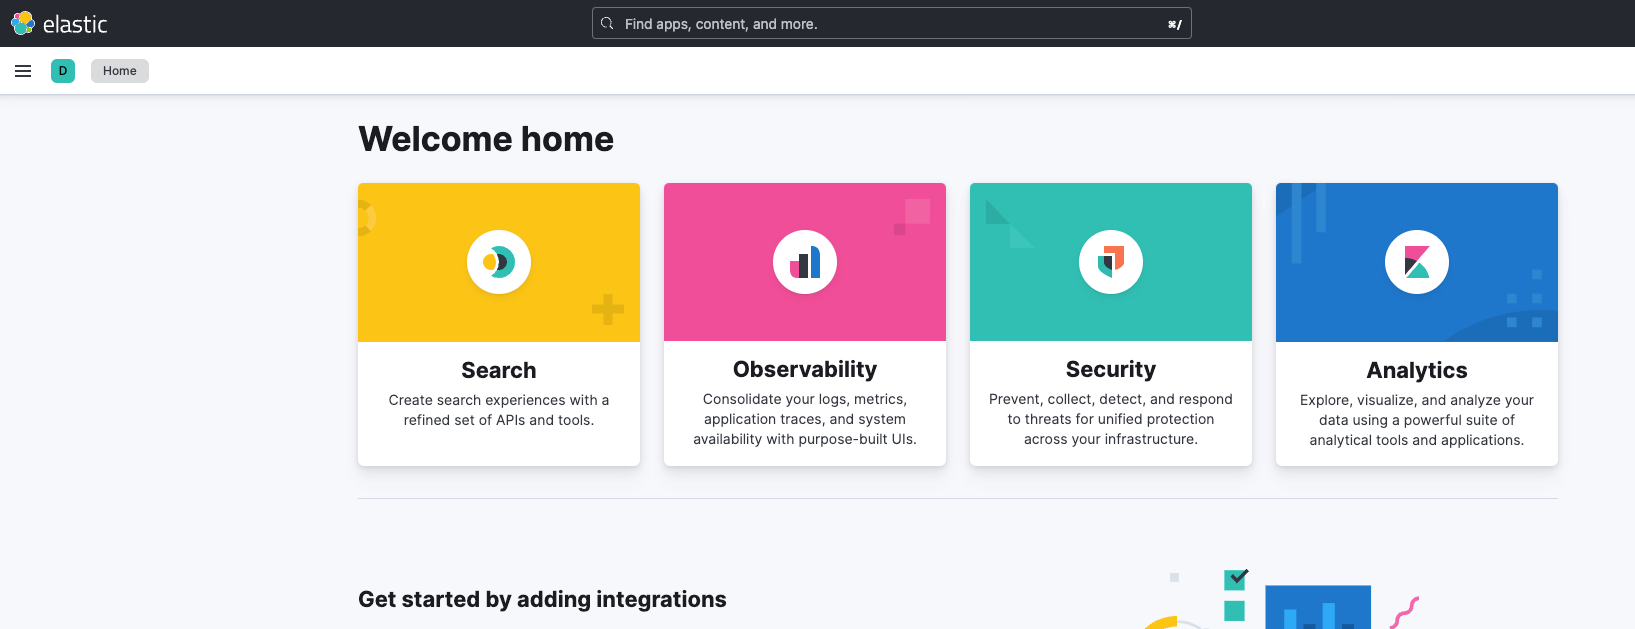
6. Open your Elastic Cloud deployment. In the Kibana “Welcome home” dashboard, select the Observability use case.

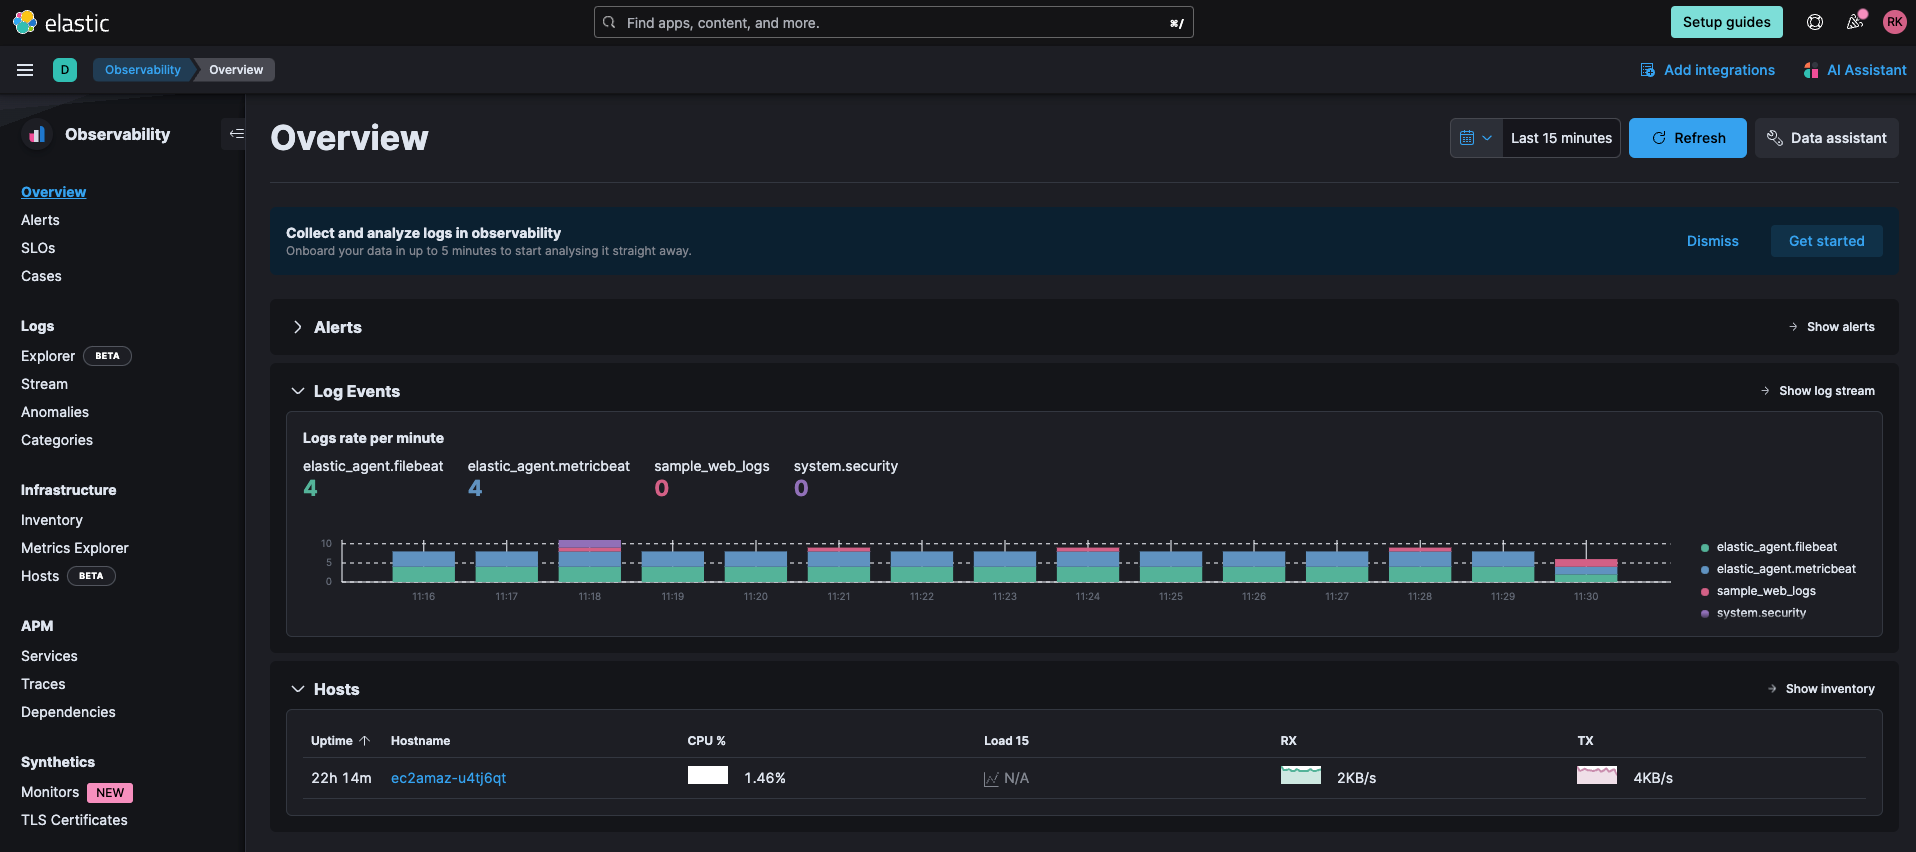
7. Elastic Observability will trigger alerts based on rules that are configured. There are several places to create rules in Kibana. In this example, a rule is created from an individual host’s Overview. On the Overview dashboard, select an EC2 instance being monitored underneath Hosts, and then click on Manage Rules on the far right of the host’s “Alerts.”
8. Click on Create rule.
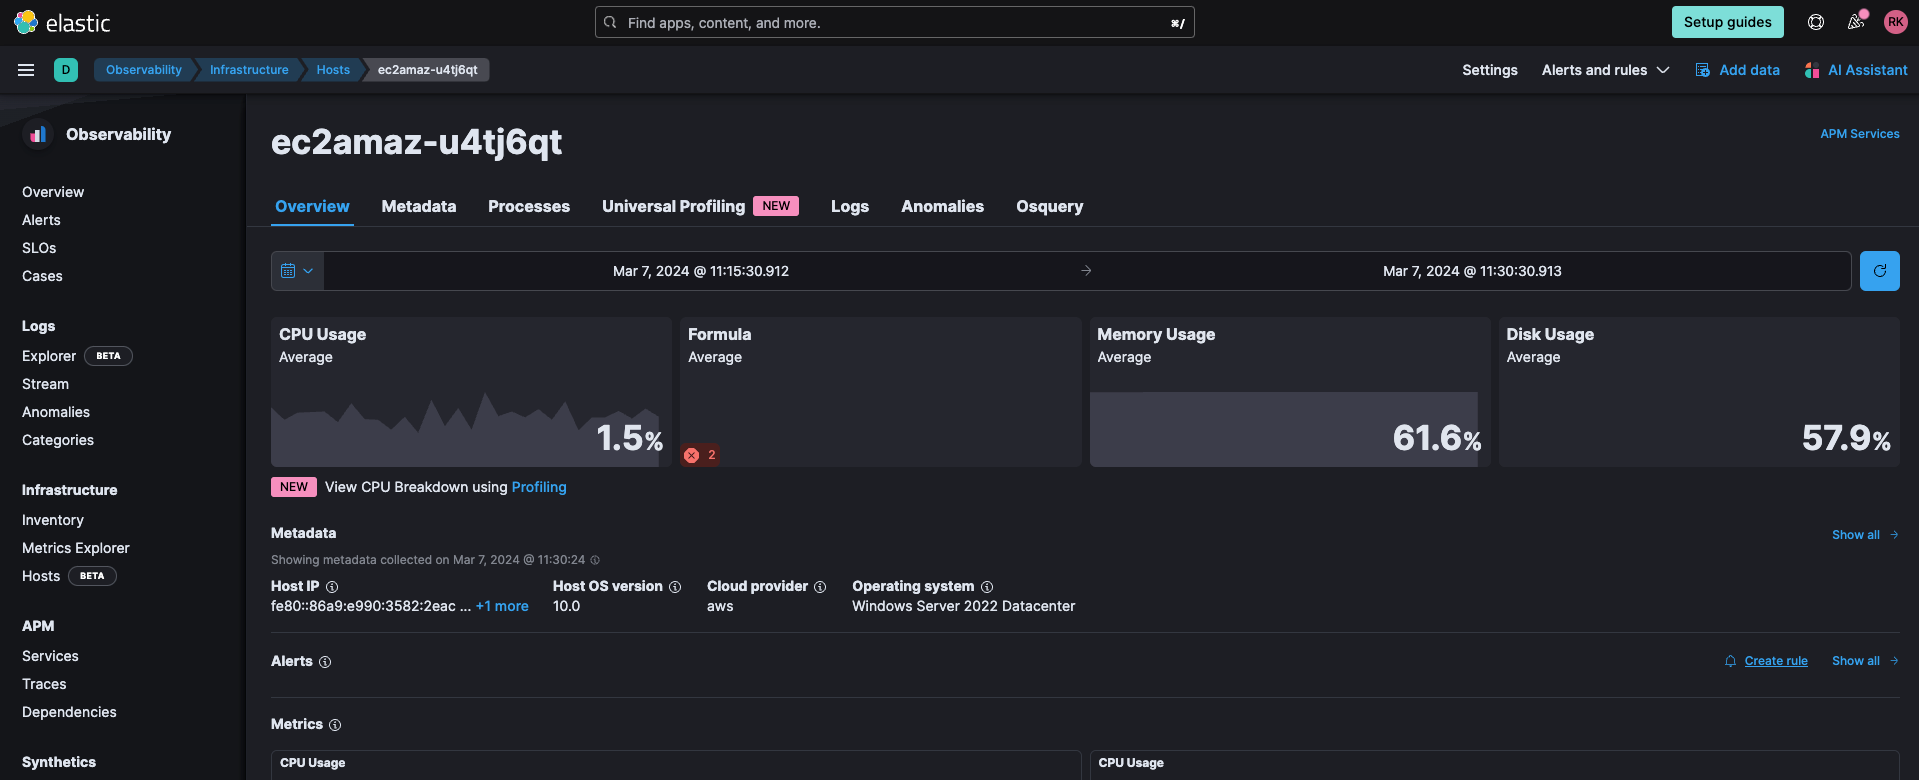
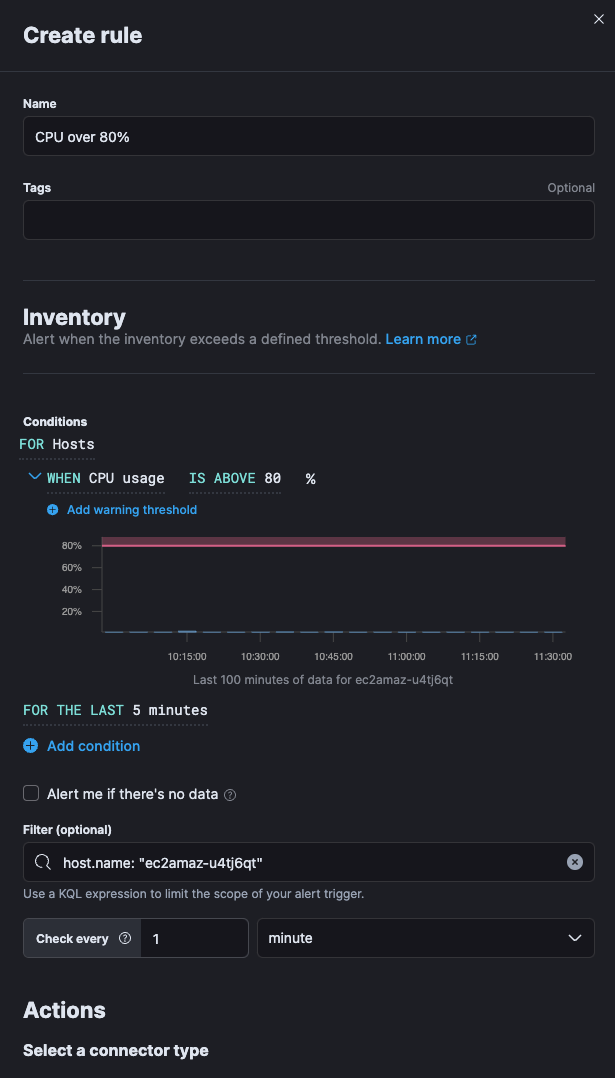
9. This rule, when breached, will trigger a Webhook action into the Tines story. First define the "Conditions" that are going to be used to trigger this alert. The criteria will be catered to your organization. In this case, we are using the CPU field, so that if the CPU usage of the host is over 80% for a period of 5 minutes, we will trigger the alert. If you want this alert to monitor all your hosts, make sure to remove all values from “Filter.”
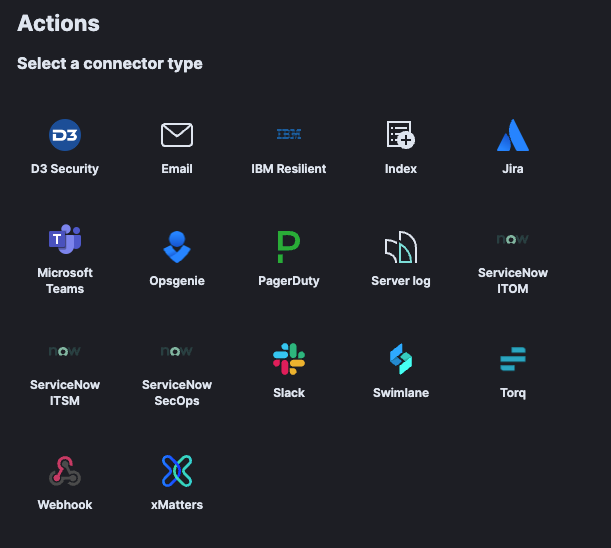
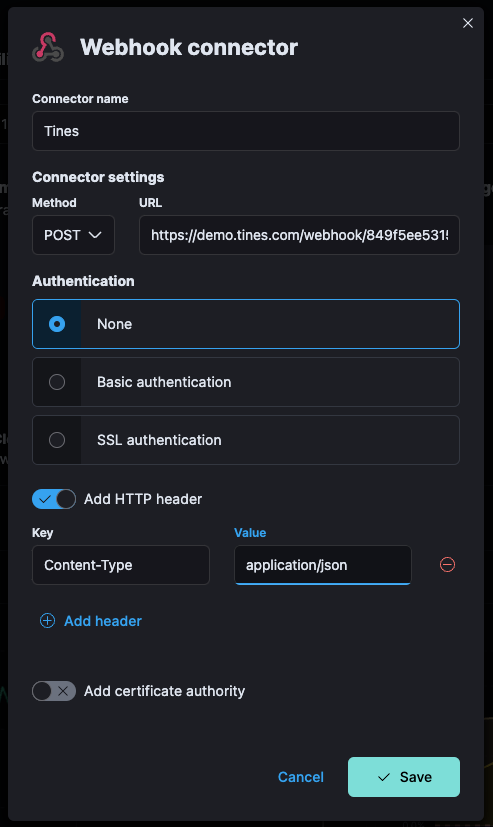
Under “Actions,” select the Webhook connector and configure the Tines Webhook URL that was copied in Step 4 above. Make sure to edit “add HTTP Header” as shown below for your event to come into Tines as neatly formatted JSON. The “Action frequency” and “Body context” in the images below show the parameters sent within this example test environment. You should cater this to your organizational requirements.
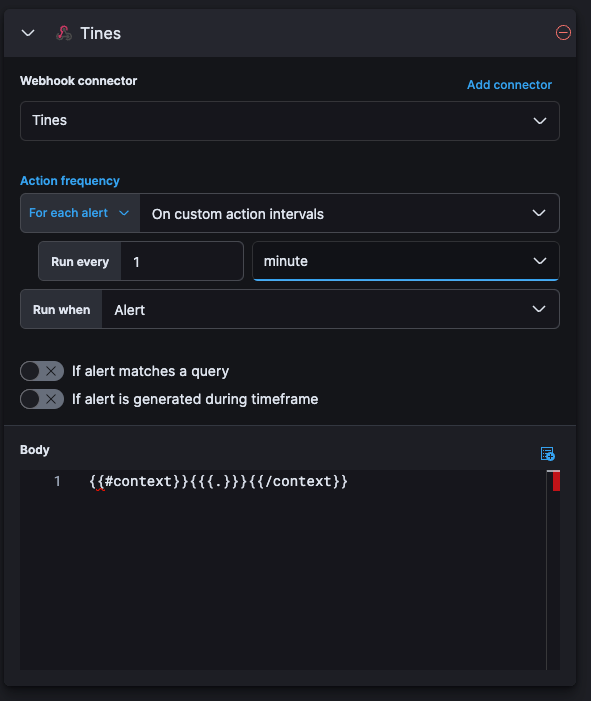
10. Click Save. Once the CPU Usage rate matches the rule, your Elastic Observability Alerts will start sending into your Tines Webhook for workflow processing.
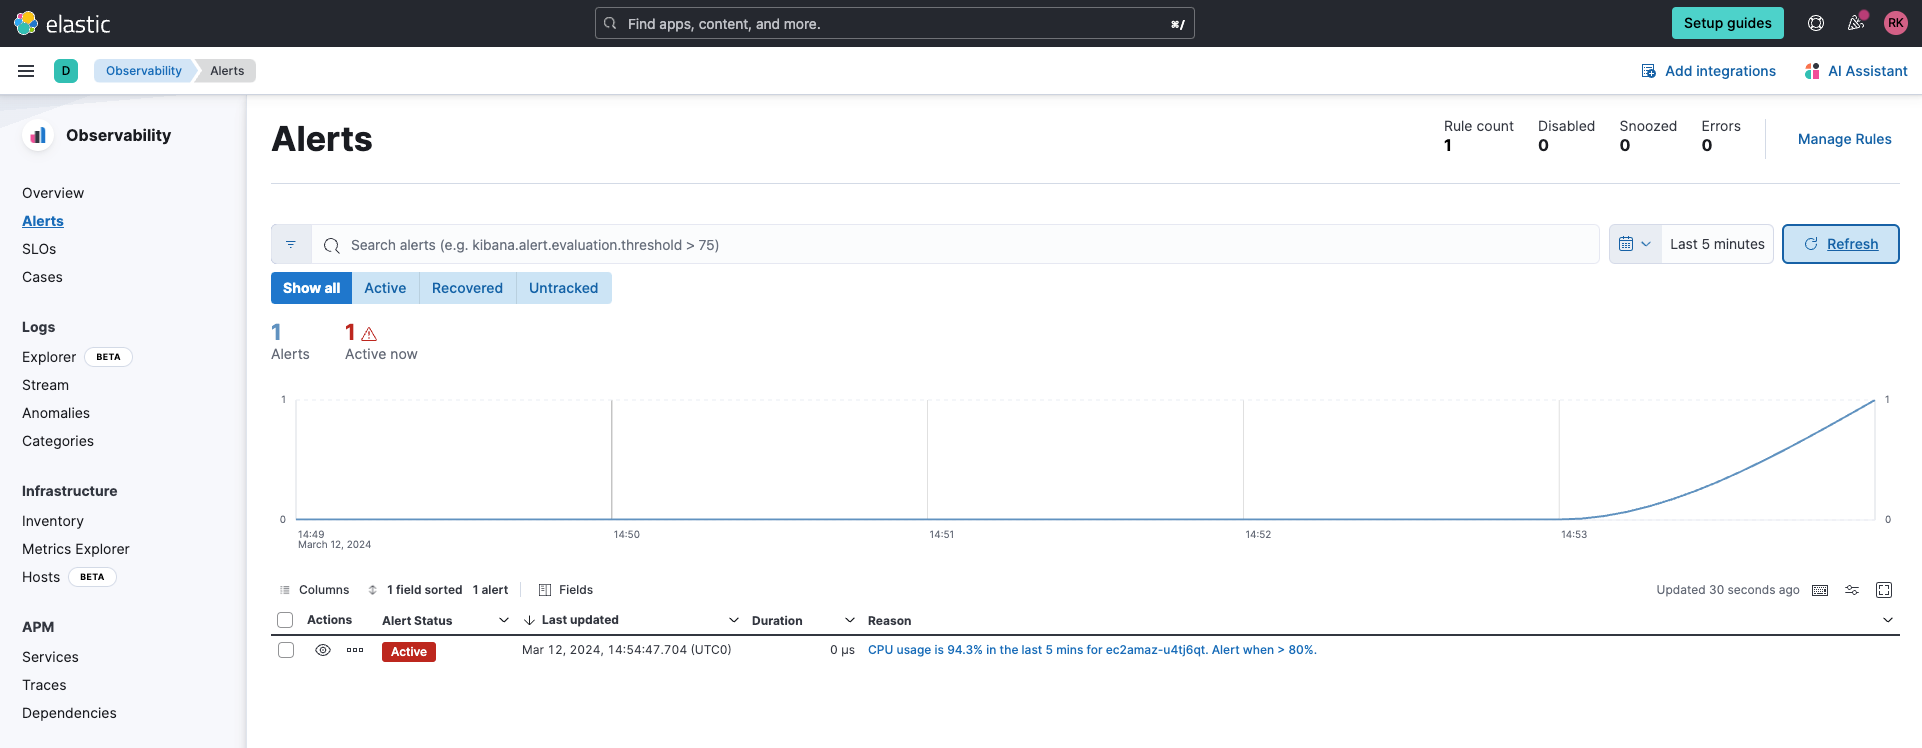
11. Once an alert is generated in Elastic, it will issue a “Webhook” to your Tines tenant as below:

Click on the Tines logo in the top left corner.
12. Select Cases.
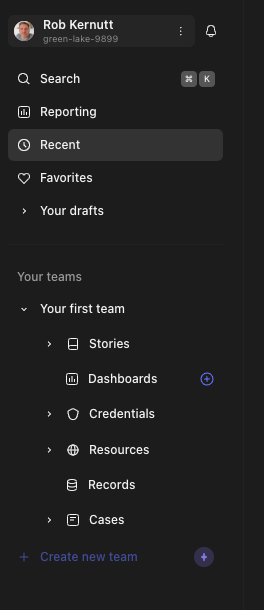
13. Select the case that has been logged.
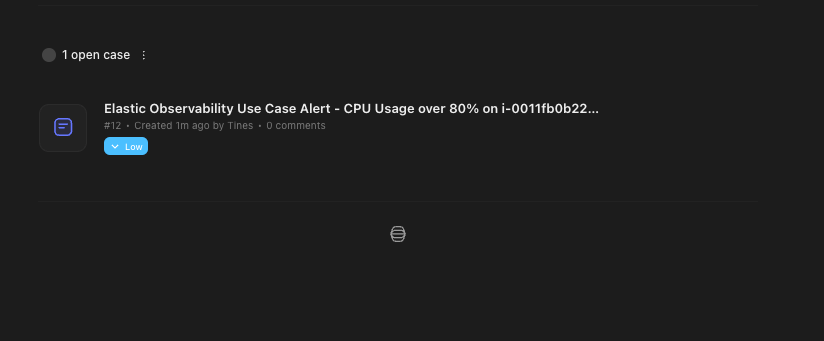
Then click on Open under “Actions” to launch the pages to change the instance.
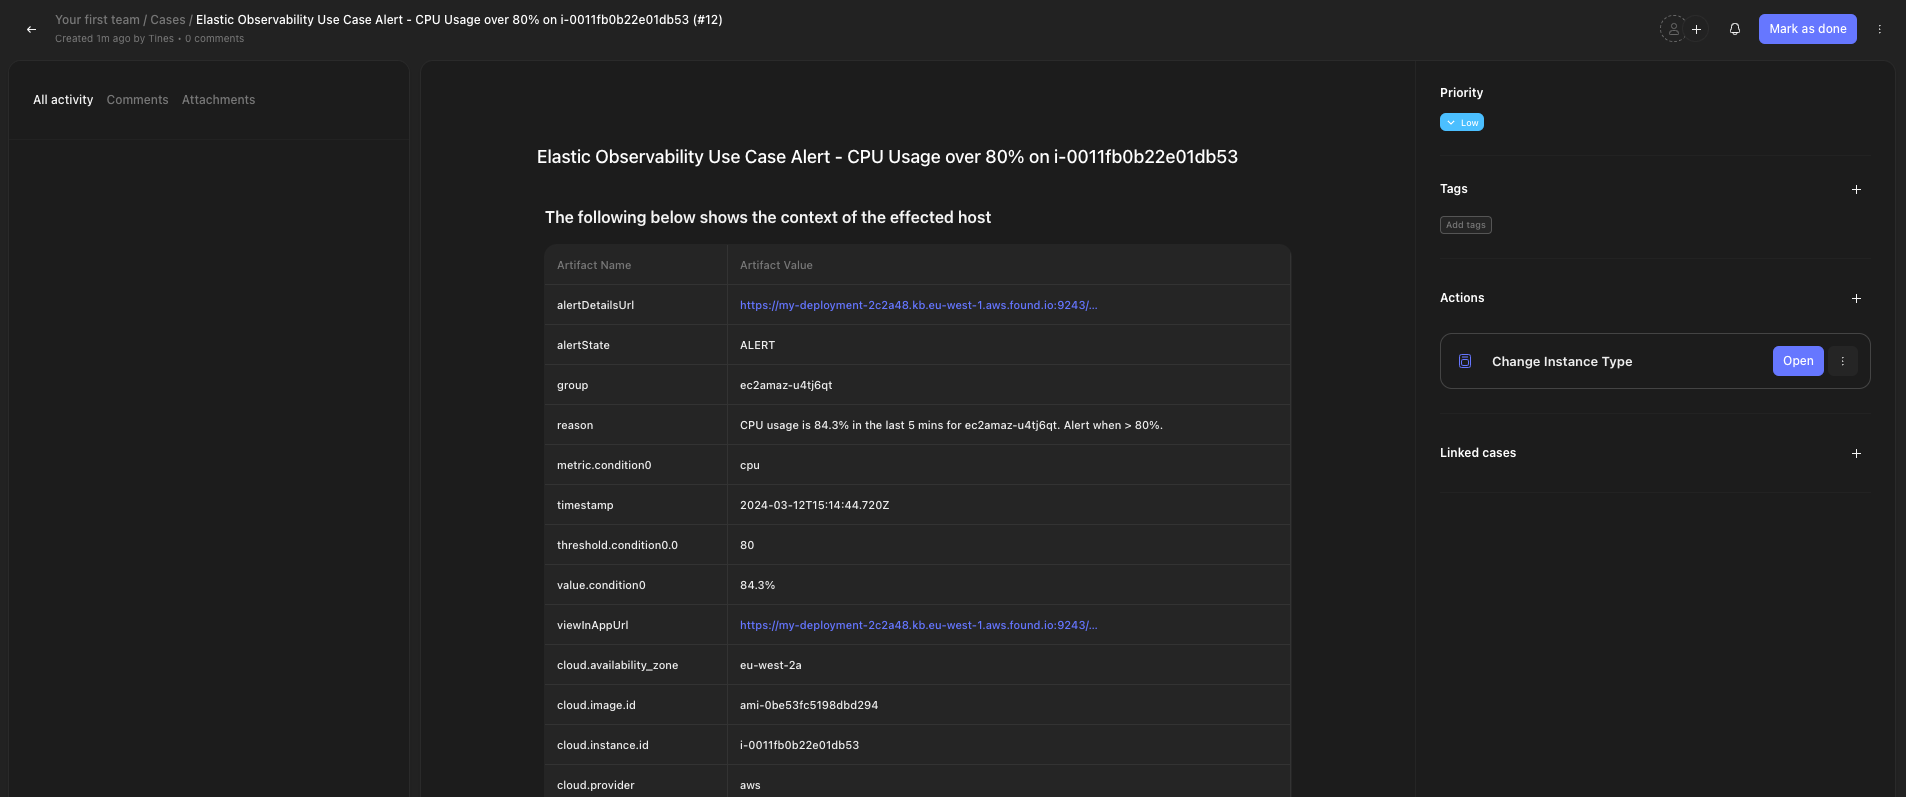
14. This will launch a new window with the page to change the instance type:
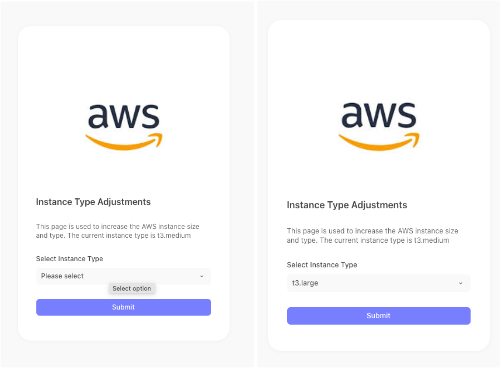
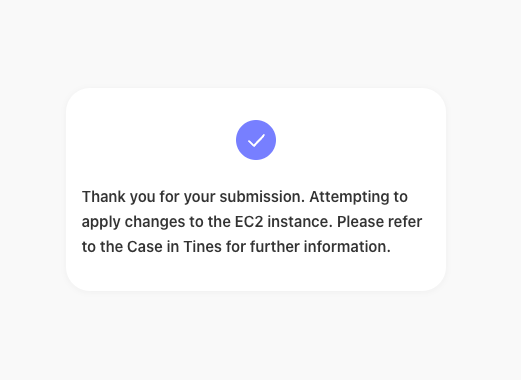
From the “Select Instance Type” dropdown, choose the instance type you wish to change to and click Submit. You will get a confirmation:
15. If you have access to the AWS EC2 Console, you can now see the changes the Tines story will be making to your instance:


16. Back in the Tines Case, you will see a comment that the instance has started with the changes applied:
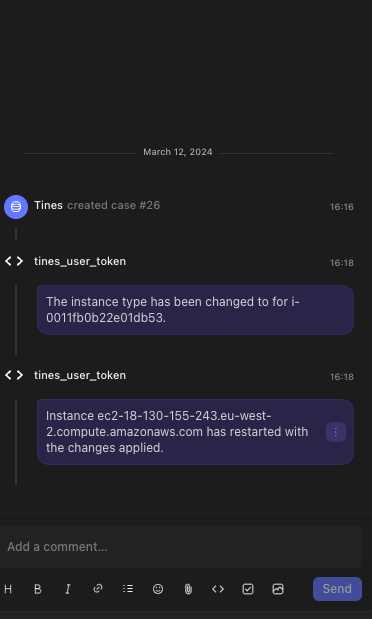
You’ve now seen how easy it is to configure Elastic Observability and Tines together to simplify the process of identifying over-utilized resources and make changes to an AWS EC2 instance.
A unified solution for cloud optimization
The combination of Tines and Elastic offers a powerful solution for optimizing cloud resource costs and driving operational efficiency. By harnessing the insights provided by Elastic Observability and leveraging the workflow automation capabilities of Tines, engineers can streamline operations, reduce manual overhead, and achieve significant cost savings as organizations continue to embrace cloud computing.
Users can get started with a free 14-day trial of Elastic Cloud, which includes extensive Observability, Security, and Search solutions. The story highlighted in this blog is just one of many available via the Tines story library, and users can sign up for the always free Tines Community Edition to start automating workflows.
* Cases is leveraged by the Tines Story in this blog. Cases is a chargeable add-on: Understanding Tines pricing plans.
The release and timing of any features or functionality described in this post remain at Elastic's sole discretion. Any features or functionality not currently available may not be delivered on time or at all.