Elastic Agent’s new output to Kafka: Endless possibilities for data collection and streaming

Introducing Elastic Agent's new feature: native output to Kafka. With this latest addition, Elastic®’s users can now effortlessly route their data to Kafka clusters, unlocking unparalleled scalability and flexibility in data streaming and processing. In this article, we'll delve into the benefits and use cases of this powerful integration.
Elasticsearch and Kafka: Better together use cases
In the ever-evolving landscape of the Internet of Things (IoT), automated plants, and complex IT architectures in industries like automotive or manufacturing, precision and real-time data are paramount. Imagine a production line in a high-tech automotive plant, where thousands of sensors are constantly monitoring the machinery's performance, from the precise torque of a robotic arm to the temperature of a critical engine component. Think about how many distributed devices are surrounding us every day that need to be remotely managed, monitored and secured to ensure the best user experience while collecting valuable data for businesses. In this dynamic environment, the need for efficient data ingestion, real-time processing, and robust data storage and analysis is not just a preference — it's an absolute necessity.
This is where Kafka, with its powerful data streaming capabilities, emerges as a linchpin technology, seamlessly connecting the world of IoT and distributed systems to Elasticsearch®, a leading insight engine on the market, to enable rapid decision-making, predictive maintenance, and enhanced operational insights.
In this article, we will explore how Confluent Kafka and Elasticsearch, when harnessed in tandem, are offering even more unparalleled insights, resilience, and efficiency thanks to the new Elastic Agent integration.
Elastic Agent’s Kafka output unlocks new possibilities
Kafka is often the preferred choice for scenarios demanding efficient management of high-volume data, and many Elastic users are already adopting it for several use cases between their environments, instrumented with Beats, and Elasticsearch clusters. Beats have integrated a native Kafka output for a long time now and many customers are happily using both, but today the same feature is also available with our Elastic Agent, our unified solution for instrumenting every host you manage to monitor metrics, collect logs and tackle cyber threats. So why is this new Elastic Agent feature so important and what are the reasons you should start using it today?
The Elastic Agent has several advantages over Beats:
Easier deployment and management: Elastic Agent is a single agent that downloads, configures, and manages any underlying policy or component required to collect and parse data. This eliminates the need to deploy multiple Beats and manage separate configuration files for each Beat running on a host.
Easier configuration: Instead of defining and managing separate configuration files for each Beat, you define a single agent policy that specifies which integration settings to use, and the Elastic Agent generates the configuration required by underlying tools.
Central management: Elastic Agents can be managed from a central location in Kibana® called Fleet. In Fleet, you can view the status of running Elastic Agents, update agent policies and push them to your hosts, and even trigger binary upgrades. No more SSH to your hosts or software management tools needed.
Endpoint protection: Elastic Agent enables you to protect your endpoints from security threats. This allows customers to extend their Elastic value with new Security use cases on the data they are collecting with no additional tools or effort.
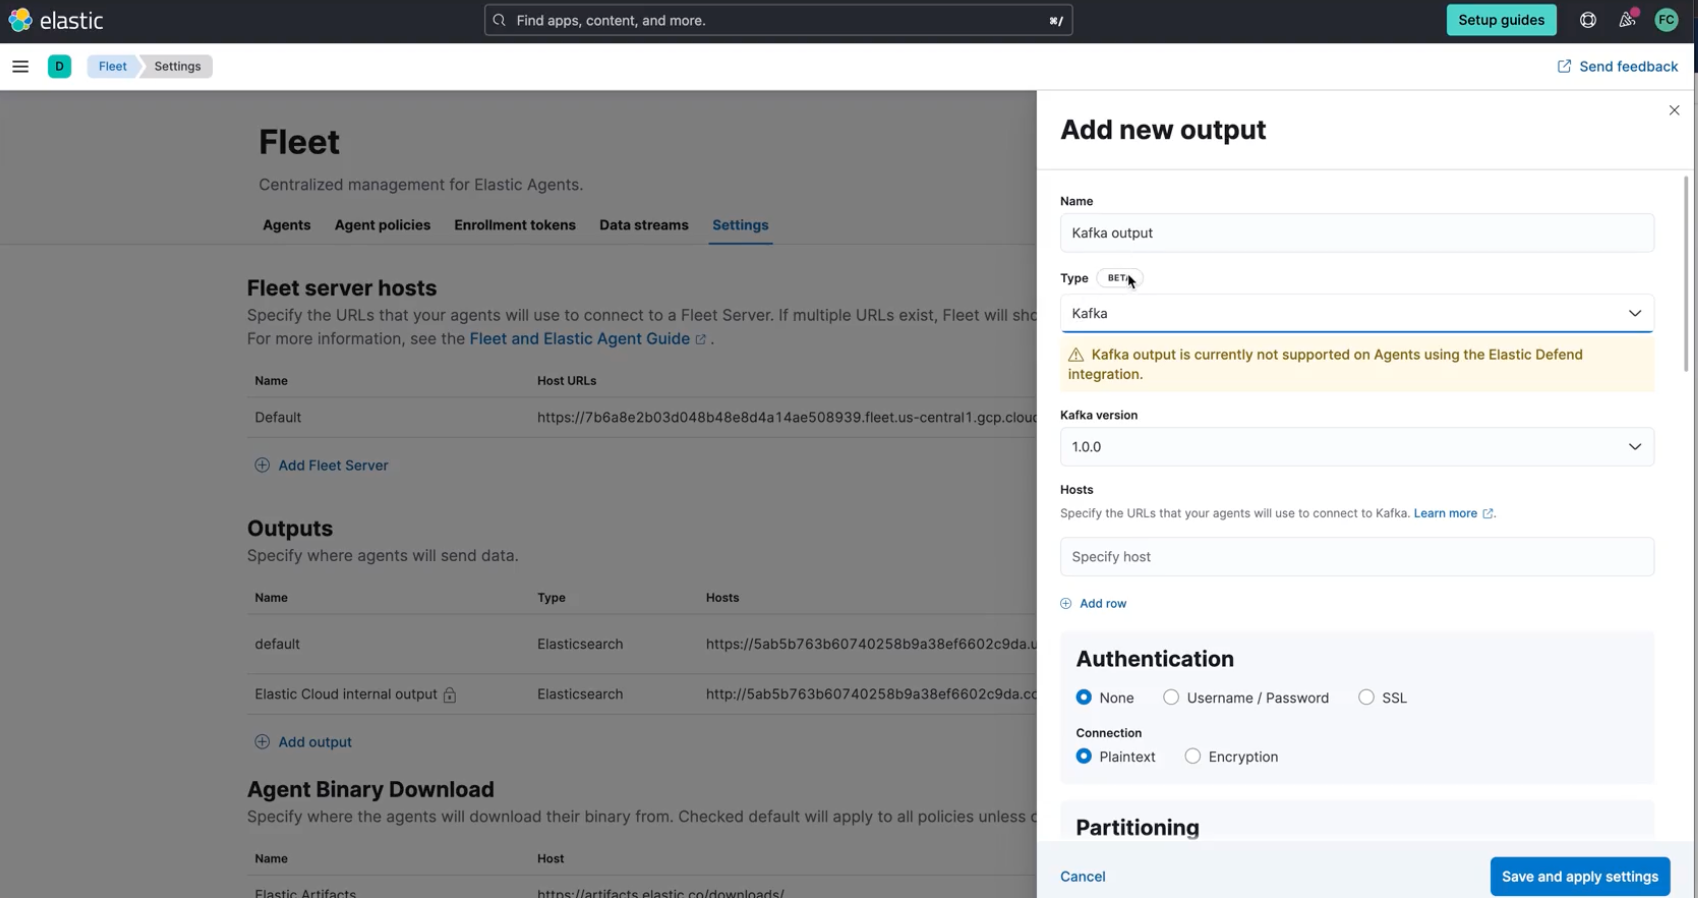
With those benefits and features, managing and securing your distributed systems has never been easier! To register a new Kafka output for the Fleet-managed Agent all you need to do is:
- Open Fleet’s Settings tab in the Kibana UI.
- In the Output section, Add output.
- Give your new output a name and select Kafka as output Type.
- Fill out all the relevant Kafka cluster fields needed for your scenario, such as Kafka broker’s hostname, authentication details, or SSL configuration.
- Save and apply settings.

You will be able to set partitioning rules and a topic to send data to, the topic is statically defined.
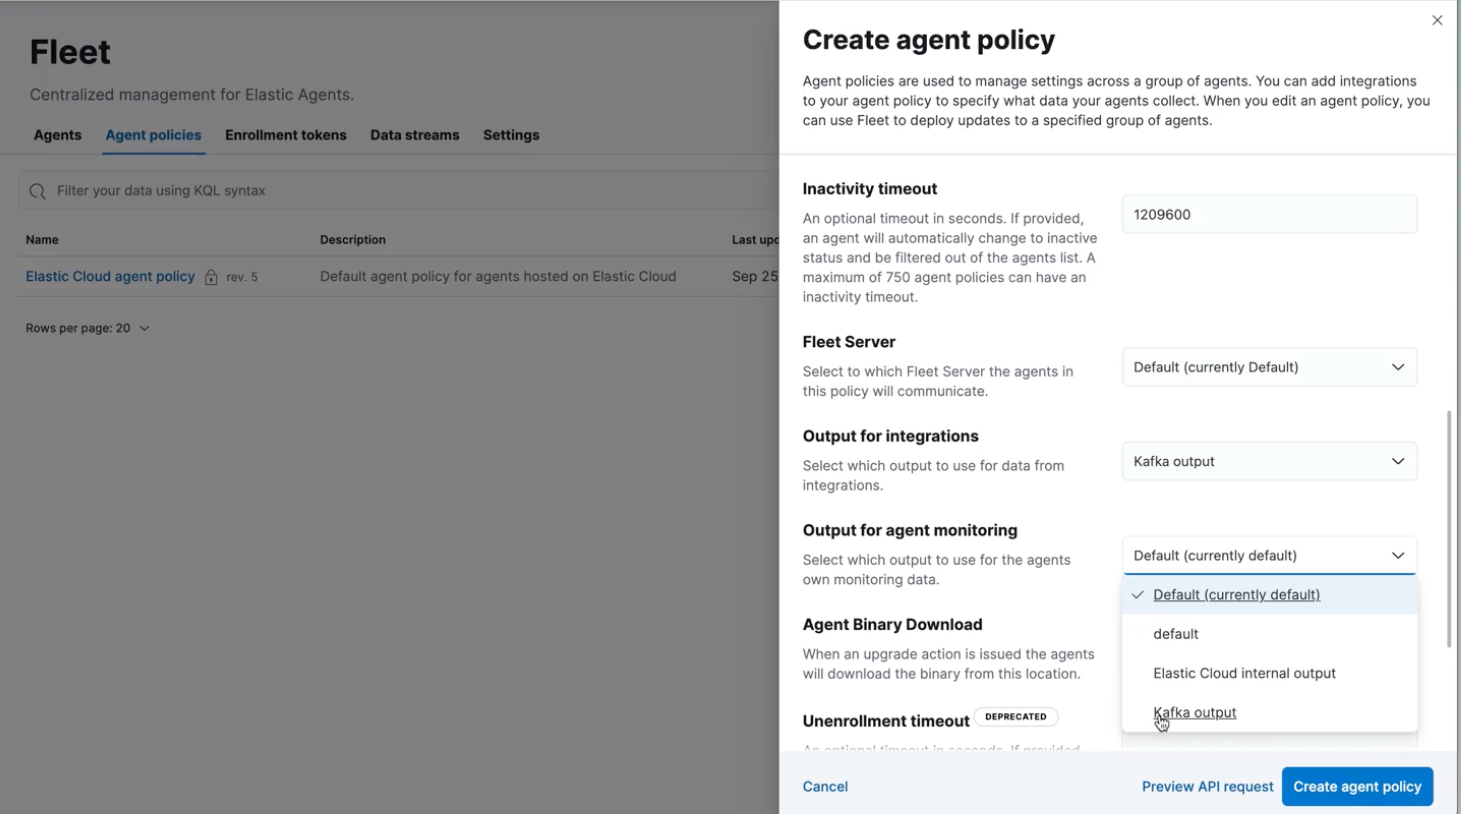
Kafka output will be then available at the agent policy creation phase, where it may be set for both integration and agent monitoring streams and automatically applied on the agent you decide to attach them to.

You can explore all the details and options in our official documentation or be guided with a step-by-step configuration walkthrough.
Existing Kafka users with beats, with this newly released integration, will be able to switch their workloads to the Elastic Agent and benefit from all the aforementioned enhancements to their Observability and Security scenarios. Moreover, current Elastic Agent users will have no more roadblocks to evaluate and adopt Kafka as their Elastic end-to-end data streaming partner.
The architecture overview

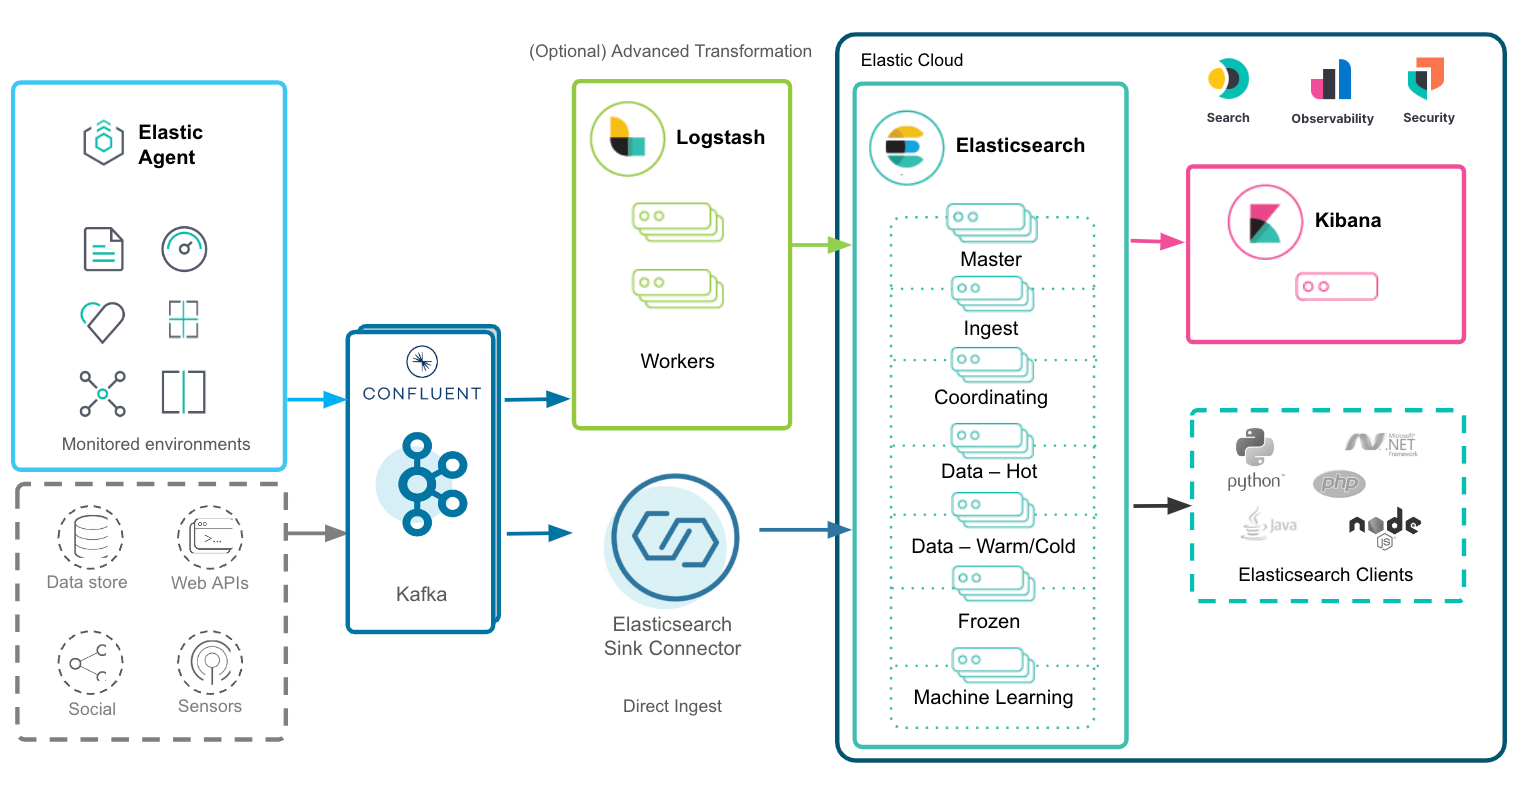
In the overall architecture diagram above, Elastic Agent, Confluent Kafka, and Elastic Cloud are shown as main components of the data journey.
The Elastic Agent will collect logs and metrics from an enormous number of hosts and systems through its native integrations and together with Confluent Cloud connectors, handling events and transactional data coming from multiple data sources, endless possibilities will arise to gather, consolidate, and enrich your enterprise data in a single pane of glass.
Kafka will then receive these different data streams and process and distribute them to the relevant consumer. For advanced scenarios, where powerful transformations are needed (e.g., native IP geolocalization, derive structured data from unstructured, PII masking), Logstash® can be inserted between Kafka and Elasticsearch thanks to its dedicated input and output plugins. For direct seamless streaming from Kafka to Elasticsearch, instead, the best choice would be leveraging the Elasticsearch Sink Connector, configurable with few clicks via Confluent UI.
Once the data lands into Elastic, here is where data starts shining, expressing its value thanks to the Elasticsearch and Kibana search, analytics, and visualization capabilities. We will go into more detail about this in the following sections.
Confluent Kafka benefits to Elastic workloads
Confluent’s Kafka offers several benefits when integrated with Elasticsearch for handling Elastic workloads, especially in scenarios where you need to process and analyze large volumes of data in real time or near real time. Some of the key benefits of using Kafka in conjunction with Elasticsearch for Elastic workloads include:
1. Fully managed service
Confluent Cloud is a fully managed service, which means Confluent takes care of the underlying infrastructure, including hardware provisioning, software maintenance, and cluster scaling. This offloads operational overhead from your team and allows you to focus on building applications and processing data.
2. Real-time data ingestion
Kafka excels at collecting and ingesting data in real time, making it an ideal choice for streaming data to Elasticsearch. Confluent connectors are designed to simplify the process of streaming data from Kafka to Elasticsearch and vice versa, making it easier to build real-time data pipelines for various use cases, including log and event data analysis. The Confluent Elastic connectors include:
- Confluent Elasticsearch Sink Connector: This connector is used to send data from Kafka topics to Elasticsearch for indexing and search. It allows you to specify which Kafka topics to consume data from and which Elasticsearch indices to write data to. The connector supports a variety of data formats, including JSON, Avro, and more.
- Confluent HTTP Sink Connector: This connector consumes records from Kafka topics and converts them to a String or a JSON with before sending it in the request body to the configured API URL, in this case the Elastic API endpoints. This can be useful in scenarios where fully customizable API calls are needed.
- Confluent Elasticsearch Source Connector: This connector is meant to pull data from Elasticsearch and stream it into Kafka topics. It allows you to create topics and map Elasticsearch indices to Kafka topics for data synchronization.
3. Data aggregation and transformation
Kafka can act as a buffer for data, allowing you to perform data aggregation and transformation before indexing it into Elasticsearch. Confluent developed KSQL and a related datastore (ksqlDB), which are SQL-like query tools for processing streaming data directly into Kafka. This simplifies real-time data processing, enabling users to create applications with ease and providing a helpful hand to prepare data to be searched and visualized in Kibana.
4. Scalability
Kafka is highly scalable and can handle high data throughput. It allows you to scale both horizontally and vertically to accommodate growing data workloads. This ensures that your Elastic workloads can keep up with increasing data volumes and processing demands with Kafka being its shield to unexpected spikes and ingesting pressure. Confluent Cloud allows you to scale your Kafka clusters seamlessly as your data and workload requirements grow. You can easily adjust the cluster size, storage, and throughput to accommodate changes in data volume and processing needs.
5. Decoupling of data sources and consumers
Kafka acts as an intermediary between data sources and Elasticsearch. This decoupling allows you to add or remove data producers and consumers without affecting the overall system's stability. It also ensures that data is not lost if Elasticsearch or the connecting network experience downtime.
6. Optimized Elasticsearch indexing
By using Confluent’s Kafka as an intermediary, you can optimize the indexing process into Elasticsearch. Data can be batched and compressed before being sent to Elasticsearch, reducing the load on the Elasticsearch cluster.
7. Unified data integration
Kafka integrates well with various data sources and sinks. It can ingest data from a wide range of systems, making it easier to centralize data into Elasticsearch for comprehensive analysis. The Elastic Agent combined with Kafka integrations gives you unlimited possibilities to collect and move data.
8. Partnering with Logstash
Kafka plugins allow Logstash to consume data from Apache Kafka topics as input or send data to Kafka topics as output. These plugins are part of the broader Logstash ecosystem and are widely used to integrate Logstash with Kafka in various workflows.
- Kafka input plugin: The Kafka input plugin allows Logstash to consume messages from one or more Kafka topics and process them within Logstash. You can configure the Kafka input plugin to subscribe to specific topics, consume messages, and then apply various Logstash filters to transform and enrich the data as needed.
- Kafka output plugin: The Kafka output plugin allows Logstash to send processed data to Kafka topics. After data is processed and enriched within Logstash, you can use this plugin to publish the data to specific Kafka topics, making it available for downstream processing by other applications or systems.
Search insights and detect anomalies with Elastic Cloud
Once data lands into Elastic, endless possibilities arise to generate value out of it. The application of predictive analytics leading to predictive maintenance, for instance, has been significantly enhanced through Elasticsearch. By harnessing sensor data, which includes parameters such as air pressure, oil pressure, temperature, voltage, speed, sound, frequency, and variations in color or lighting, Elasticsearch facilitates the early identification of potential device failures. This real-time data analysis, coupled with Elasticsearch's robust search and query capabilities, not only serves as an early warning system but also provides invaluable insights for data-driven decision-making. The ultimate result is reduced costs and more efficient maintenance strategies leading to operational excellence.
Furthermore, Elasticsearch empowers production management by enabling them to set individualized maintenance plans based on real-time data and adaptive thresholds. This dynamic approach supersedes rigid maintenance cycles, where components are replaced whether they are prone to failure or not. Elasticsearch's search and visualization features, particularly when leveraging Kibana features, offer a comprehensive view of data trends and outliers, leading to the development of more meaningful and cost-effective strategies. The same principles apply to higher abstraction layers such as on-prem and cloud IT architectures and applications, where resiliency and business continuity are ever increasing topics and often critical for manufacturing processes.
Nonetheless, the challenge of analyzing data from a multitude of sensors, devices, and services in real time, and comparing it to historical events, is a daunting task for human operators. This is precisely where Elasticsearch's anomaly detection capabilities, combined with its machine learning features, come into play. With Elastic, you can efficiently pinpoint deviations or correlate data from multiple sources to generate a comprehensive health score. This invaluable functionality enables businesses to stay ahead of potential issues and respond proactively, through a data-driven mechanism.
In addition to enhancing predictive maintenance and quality control, Elasticsearch plays a crucial role in ensuring the security of distributed architectures and hosts. The Elastic SIEM and endpoint protection solutions allow comprehensive monitoring, prevention, detection, and response to security events and threats, ensuring business continuity and compliance.
Collecting data and transforming it into business insights from various systems within a manufacturing plant or an IT architecture, from legacy systems running older software to cutting-edge technology, becomes a seamless process with Elasticsearch and Kafka. Moreover, in the era of cost optimization and tool consolidation, there’s no better place to achieve all your Search, Observability, and Security goals in a single pane of glass.
Explore more and try it out!
See how customers like BMW are building resilient multi-channel customer experiences with Elastic and consolidating production and sales data streams across multiple systems and applications thanks to Confluent Cloud.
Check out our 7-minute tutorial or blog post for a detailed walkthrough of integrating Confluent Cloud with Elastic through the Elasticsearch Sink Connector. Want to leverage Elastic also to monitor Kafka clusters themselves? Explore more with this article and our integration documentation for Kafka observability.
Try this out yourself! One of the easiest ways to get started and explore our capabilities is with your own free Elastic Cloud trial and Confluent Cloud trial environment, or subscribe through your favorite cloud provider’s marketplace.
The release and timing of any features or functionality described in this post remain at Elastic's sole discretion. Any features or functionality not currently available may not be delivered on time or at all.