Driving dashboard actions in Kibana with URL drilldowns
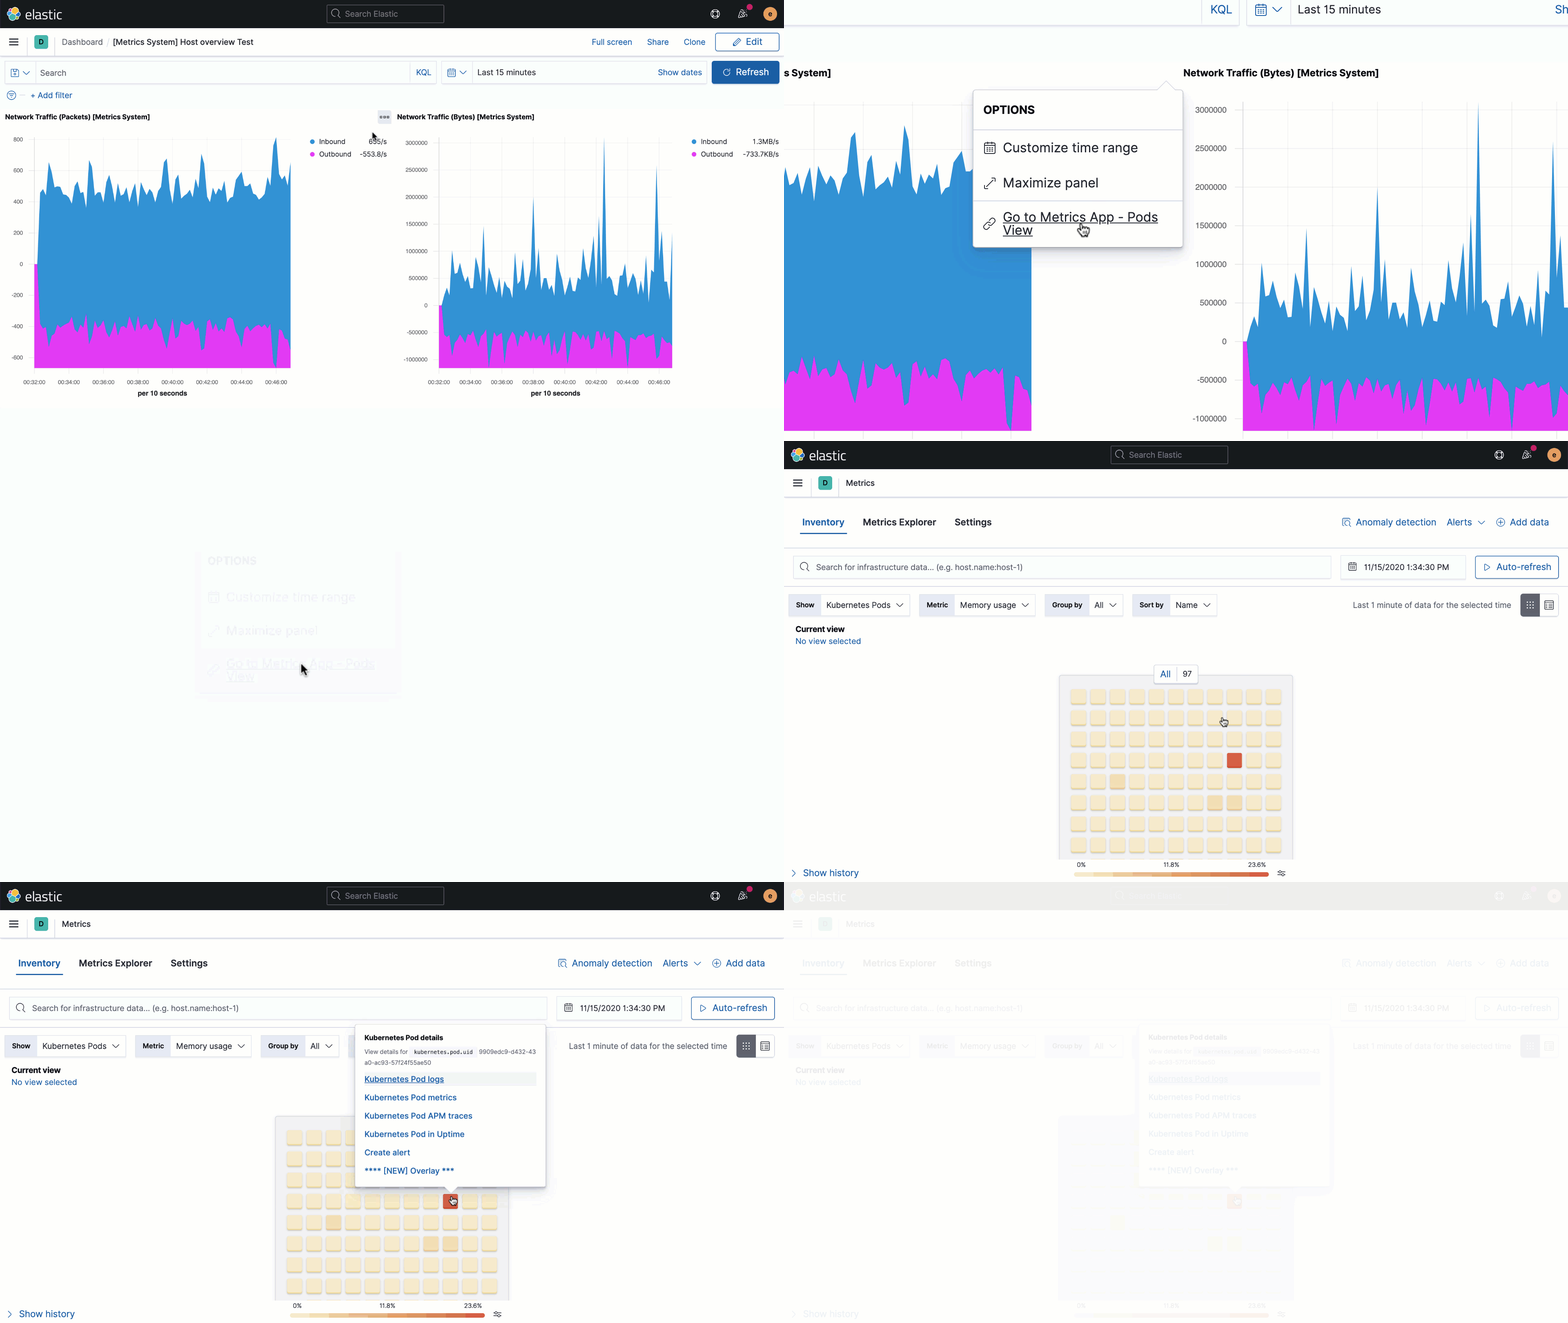
With the release of Kibana 7.10, dashboards have gained a powerful new feature: URL drilldowns that let you instantly click into any predefined webpage from a visual in a dashboard. Now you can build Kibana dashboards that provide data-driven insights and allow direct actionable paths to the systems you use every day.
To learn more about URL drilldowns, be sure to join us for the upcoming webinar, How to build dashboards that drive insight and action in Kibana.
Dashboards that let you do more than look
Kibana dashboards are a critical place where data insights are gathered together to power decision-making. Security practitioners, for example, rely on them to help spot potential threats. DevOps teams count on them to assist in monitoring for everything from availability issues to application errors.
Our goal has always been to enable you and your organization to go even further with Kibana dashboards by not just supporting data-driven insights, but also enabling data-driven action.
That’s why we introduced dashboard-to-dashboard drilldowns in Kibana 7.8. This capability lets you build analytical paths between dashboards that could be triggered by viewers in just a few clicks.
The outcome was a vastly enhanced way to use multiple dashboards for combined analysis. Then in 7.9, we introduced the ability to move from visualizations in a Kibana dashboard directly to the Discover app to inspect a specific selection of data at the document level. This unlocked a more seamless investigation experience for Dashboard users needing to move from the 30,000-foot aggregated view down to the ground level in seconds.
Both of these enhancements to Kibana dashboards were important steps toward transitioning how you use data in the Elastic Stack to stay informed and actually take further action to address issues.
Try URL drilldowns (beta) today
With 7.10, we’re taking the entire idea of actionability in a dashboard to a new level: We’re rolling out the beta release of URL drilldowns that let you navigate from a Kibana dashboard to any webpage. Now a security practitioner can spot a threat in their SOC dashboard and — in a single click, go directly to systems that help them trigger escalations. And a DevOps team can now seamlessly initiate mitigation procedures the second they spot issues in their Kibana monitoring dashboards by moving straight to their IT ticketing systems.
The new URL drilldowns capability also allows for values from a view in a Kibana dashboard to be passed as a querystring parameter within the URL itself. This includes the ability to even do things like serialize values and format dates using Handlebar helpers.
What if a single click from a security analyst brought them to the right dashboard to take action and also pre-populated necessary fields with data coming from the Elastic Stack? From our conversations with customers, we know that seemingly small capabilities like this actually have dramatic impacts when it comes to being able to respond with both urgency and context.
Three ways to drive action with URL drilldowns
1. Provide more context
Use URL drilldowns to point viewers to resources providing additional context about an analysis.
2. Deep link to locations in the Elastic Stack
Use URL drilldowns to navigate viewers to places in the Elastic Stack where they may want to take specific action depending on the data insight they’ve discovered (e.g. create an alert, ingest a file, examine an anomaly, and more.)

3. Create a new incident, trigger an escalation
Use URL drilldowns to create news forms and encode values in the URL strings from the Kibana visualization in the dashboard to populate things like priority status, short descriptions, timestamps, and more.
Start driving action today
URL drilldowns for Kibana dashboards are available now in beta with the 7.10 release. Try them now with a free trial of Elasticsearch Service on Elastic Cloud or download the latest builds.
To learn more about making your Kibana dashboards actionable and see URL drilldowns demonstrated live, join us for the upcoming Kiband Dashboard webinar and check out the rest of the amazing Kibana 7.10 features.