'Cause We're Living in a (Reporting) World
Editor's Note (August 3, 2021): This post uses deprecated features. Please reference the map custom regions with reverse geocoding documentation for current instructions.
Back in October 2016, I wrote a blog post (You get a report! You get a report!) on how to get started with the then-newly released X-Pack reporting feature. A lot has changed in this feature since its original release, and a quickly growing number of users are adopting it as the primary way to share reports of their favorite Kibana visualizations, dashboards and saved searches. New to Kibana or just not on the latest version? Check out our documentation for the latest getting started information.
Over the past year, we've taken your feedback on our reporting feature and turned it into a reality. There are a number of new enhancements available in reporting today, requested by you — our users. This follow-up blog post walks you through these exciting improvements and provides tips on troubleshooting a few common issues.
Recent Improvements and Enhancements
You get a CSV export!
The ability to export raw documents from Discover (saved search), one of the most requested enhancement requests, is available in the Basic (free) version of X-Pack 6.0 and above. Prior to 6.0, saved searches were only captured as screenshots within the PDF report. With CSV export, raw documents from saved searches are now exported using the popular CSV format which makes it easy to import into Excel and other integration tools. To export raw documents from a saved search on the Discover screen, use the new CSV export feature (Discover > Reporting > Generate CSV).

With a Watcher integration, you can automate the sending of CSV export of saved searches to supplement the PDF report with raw documents. The following is an example watch that attaches both the PDF report and a CSV export of the saved search in the same email. It is much easier with the reporting email attachment type available in versions 5.1 and above (prior to 5.1, Watcher integration requires putting together your own http attachment type with the correct headers, etc.).
Note: When configuring the watch, the URLs used in the reporting type are available from the Generation URL field under the Reporting sections for Discover and Dashboard in Kibana. The user specified requires reporting_user and kibana_user built-in roles as well as a custom role that provides sufficient privileges to query the indices backing the visualizations and saved searches in the report and CSV requested.
{
  "trigger": {
    "schedule": {
      "interval": "1h"
    }
  },
  "actions": {
    "email_admin": {
      "email": {
        "to": "[email protected]",
        "subject": "My Report",
        "attachments": {
          "my_saved_search_export.csv": {
            "reporting": {
              "url": "http://localhost:5601/api/reporting/generate/csv?jobParams=(conflictedTypesFields:!(),fields:!(%27@timestamp%27,beat.hostname,beat.version,system.process.name,system.process.memory.rss.bytes,system.process.state),indexPatternId:%270c694c60-2975-11e8-a445-e50b6266a588%27,metaFields:!(_source,_id,_type,_index,_score),searchRequest:(body:(_source:(excludes:!(),includes:!(%27@timestamp%27,beat.hostname,beat.version,system.process.name,system.process.memory.rss.bytes,system.process.state)),docvalue_fields:!(%27@timestamp%27),query:(bool:(filter:!(),must:!((match_all:()),(range:(%27@timestamp%27:(format:epoch_millis,gte:1365034274074,lte:1522800674075)))),must_not:!(),should:!())),script_fields:(),sort:!((%27@timestamp%27:(order:desc,unmapped_type:boolean))),stored_fields:!(%27@timestamp%27,beat.hostname,beat.version,system.process.name,system.process.memory.rss.bytes,system.process.state),version:!t),index:%27metricbeat*%27),title:%27New%20Saved%20Search%27,type:search)",
              "retries": 6,
              "interval": "15s",
              "auth": {
                "basic": {
                  "username": "my_reporting_user",
                  "password": "changeme"
                }
              }
            }
          },
          "my_dashboard.pdf": {
            "reporting": {
              "url": "http://localhost:5601/api/reporting/generate/printablePdf?jobParams=(browserTimezone:America%2FLos_Angeles,layout:(id:print),objectType:dashboard,queryString:%27_g%3D(refreshInterval:(display:Off,pause:!!f,value:0),time:(from:now-5y,mode:quick,to:now))%26_a%3D(description:!%27!%27,filters:!!(),fullScreenMode:!!f,options:(darkTheme:!!f,hidePanelTitles:!!f,useMargins:!!t),panels:!!((gridData:(h:3,i:!%271!%27,w:4,x:0,y:0),id:!%27149801f0-2a1b-11e8-a445-e50b6266a588!%27,panelIndex:!%271!%27,title:!%27My%2BPie%2BChart!%27,type:visualization,version:!%276.2.1!%27),(gridData:(h:3,i:!%273!%27,w:8,x:4,y:0),id:!%276383d890-3770-11e8-b3bb-7fbbe39bc802!%27,panelIndex:!%273!%27,title:!%27My%2BSaved%2BSearch!%27,type:search,version:!%276.2.1!%27)),query:(language:lucene,query:!%27!%27),timeRestore:!!t,title:!%27My%2BDashboard!%27,viewMode:edit)%27,savedObjectId:b9627b10-2a1c-11e8-a752-737beb0df489)",
              "retries": 6,
              "interval": "15s",
              "auth": {
                "basic": {
                  "username": "my_reporting_user",
                  "password": "changeme"
                }
              }
            }
          }
        }
      }
    }
  }
}
You get a new layout mode!
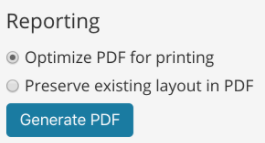
Prior to Kibana 6.1, visualizations were always formatted in a print friendly layout with two visualizations per A4 letter page. We added a new Preserve existing layout in PDF option in 6.1 that will produce a PDF report with the size and layout of visualizations preserved from the dashboard.

You get a custom logo!
You can configure a custom logo to use in PDF reports (instead of the Elastic default) by setting xpackReporting:customPdfLogo under Management > Advanced Settings in Kibana starting in version 6.2 and above. Avocado toast anyone?

You get a new reporting backend (in a future release)!
Kibana currently uses PhantomJS as the default reporting backend. PhantomJS has been a great open source project, providing a headless browser for automating web page interaction. Unfortunately, the PhantomJS project is no longer being maintained and development has been suspended. As a result, Elastic is actively working on making Chromium (an open source project started by Google that forms the basis for Chrome) the default reporting backend in the near future. In versions 6.1 and above, you can actually opt-in to switch the default reporting browser type from PhantomJS to Chromium by setting xpack.reporting.capture.browser.type: chromium in kibana.yml.
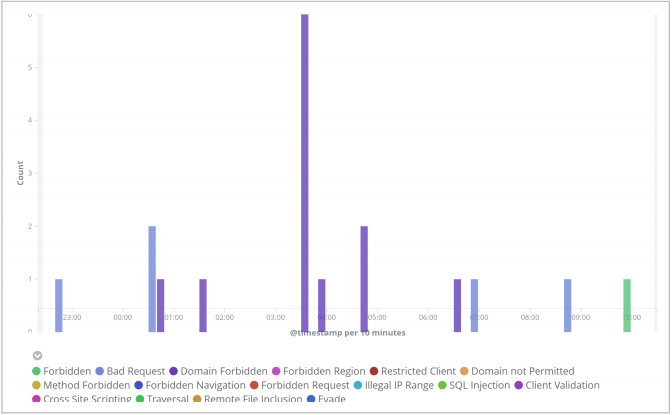
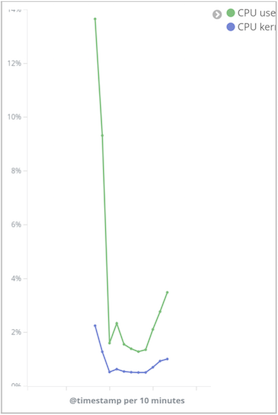
User feedback from the field has been positive so far. For example, switching to Chromium has resolved various reporting issues such as truncated legends, chart misalignment, and missing axis labels (examples below):


Troubleshooting Common Issues
How to resolve: Junk characters in visualization labels.
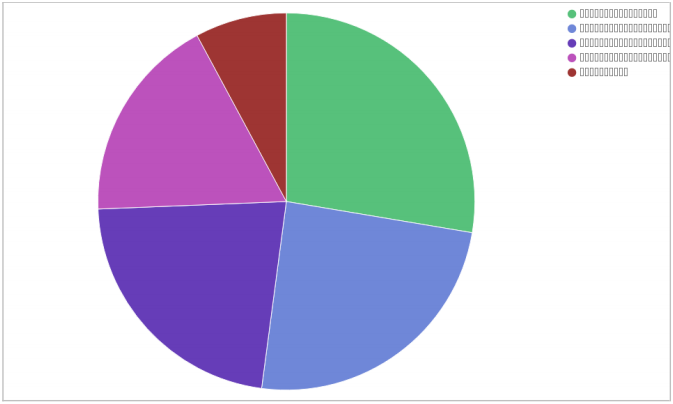
PhantomJS has various font package dependencies. If you are running on Linux, you must install the libfontconfig and libfreetype6 packages (Windows should already come with the necessary fonts). Without these dependent font libraries, you can see junk characters in report visualizations:

How to resolve: You must install freetype and ttf-font for Reporting to work.
If you have switched the default reporting backend to Chromium, the font package dependencies are slightly different. In addition to installing libfontconfig and libfreetype6 packages, chromium also requires additional font packages to be installed based on the TrueType standard for the specific OS/distro installed. For example, stix-fonts will install otf files which are based on the TrueTyle standard. Without TrueType (or equivalent) fonts installed, you will receive the following error when generating a PDF report: You must install freetype and ttf-font for reporting to work.
How to resolve: Unable to use Chromium sandbox.
This can happen if the kernel of the machine Kibana is running version <= 3.8 (which does not support user namespaces, per Chromium documentation). While you can disable sandbox via xpack.reporting.capture.browser.chromium.disableSandbox: true as a workaround, we recommend upgrading the kernel (unless you are running within a docker container). If Kibana is running on an older kernel with no user namespace support and with sandbox enabled, you will receive the following error when generating a PDF report: Unable to use Chromium sandbox.
How to resolve: Failed to decrypt report job data. Please re-generate this report.
This error happens when the xpack.reporting.encryptionKey in kibana.yml is set to one value when the report is originally requested, but is another value by the time it ends up being processed. Here are the common causes:
xpack.reporting.encryptionKeywas never set initially (so it gets randomly generated on startup) and Kibana was restartedxpack.reporting.encryptionKeywas set initially but manually changed and Kibana was restarted- There are multiple instances of Kibana running Reporting all referencing the same Elasticsearch cluster, but one or more instances is/are using a different
xpack.reporting.encryptionKey
To avoid this problem, always set xpack.reporting.encryptionKey to an explicit value that is consistently set across all Kibana instances (if connecting to the same Elasticsearch cluster).
How to handle long report generation time
For reports with many complex visualizations or if the Kibana machine is under load, a reporting worker may take over 30s to generate a report and subsequently kill further report generation with the error: Max attempts reached (3). This timeout can be tuned by setting xpack.reporting.queue.timeout in the kibana.yml.
In earlier versions of reporting, there were also unrelated issues where empty images or a “loading …” indicator were captured as screenshots instead of the actual visualizations. A lot of these issues have been addressed in 6.2 and above.
How to enable debug logging
Debug logging for reporting can be enabled by adding the following lines to kibana.yml. This will produce additional log entries such as underlying API calls, workers, screenshot images created, and more.
logging.verbose: true
logging.events.log: [ 'reporting' ]
How to review the .reporting-* indices
You can request details (eg. max attempts, priority, timeout, payload, etc..) of historical report generations by querying the system daily .reporting-* indices.
Note: This requires additional read privilege against .reporting-* indices for your user role (the built-in reporting_user role is not sufficient).
GET .reporting-*/_search
{
  "_source": {
    "excludes": [
      "output.content",
      "payload.headers"
    ]
  },
  "sort": [
    {
      "created_at": {
        "order": "desc"
      }
    }
  ]
}
How to delete older reports
Currently, Kibana does not provide a way to delete older reports from the report listing. However, you can (carefully) delete them directly from the .reporting-* indices if required using a user with the superuser role or a user with delete privileges against the .reporting-* indices noted above. As a best practice, always backup the indices before deleting any documents from them.
Hope you find this blog post helpful and happy reporting!