Expedite your SIEM migration with Automatic Migration for Dashboards

 Share on Twitter
Share on Twitter

 Share on LinkedIn
Share on LinkedIn

 Share on Facebook
Share on Facebook

 Share by Email
Share by Email

 Print this page
Print
Any well-oiled SOC can’t run without its dashboards. From monitoring critical metrics like events and throughput to viewing insights like indicators of compromise (IoCs), dashboards play a key role in day-to-day operations.
When you decide to take the leap to migrate your security information and event management (SIEM), manually recreating your dashboards in a new tool can be tedious and time consuming; extra hours (or days) spent on the migration means less time for your core functions like triaging and investigating alerts. To address this concern, Automatic Migration for Dashboards is now available in technical preview to all customers with an Enterprise license or the Security Analytics Complete tier of Elastic Cloud Serverless.
The expansion of Automatic Migration to include Dashboards now allows existing Splunk users to get started with exporting their existing custom dashboards and translating them directly into Elastic Security. The release of this technical preview is the first step to accelerating dashboard migration, allowing analysts to get back to the critical work that requires their intuition and expertise.
What is Automatic Migration for Dashboards?
Automatic Migration for Dashboards was designed with time savings top of mind. It guides users through the process of exporting existing Splunk dashboards and importing them into Elastic Security for translation on demand. This feature can help translate multiple custom dashboards, giving you clear visibility in one unified platform. With the ability to pull from all custom Splunk dashboards, you can even migrate ones that aren’t specific to security.
This feature doesn’t just copy and paste. It scans for references to macros and lookups and, when found, prompts you to upload them. Elastic Security incorporates this logic to maintain functional equivalence with the original dashboard, ensuring a thoughtful approach to migration and translation.
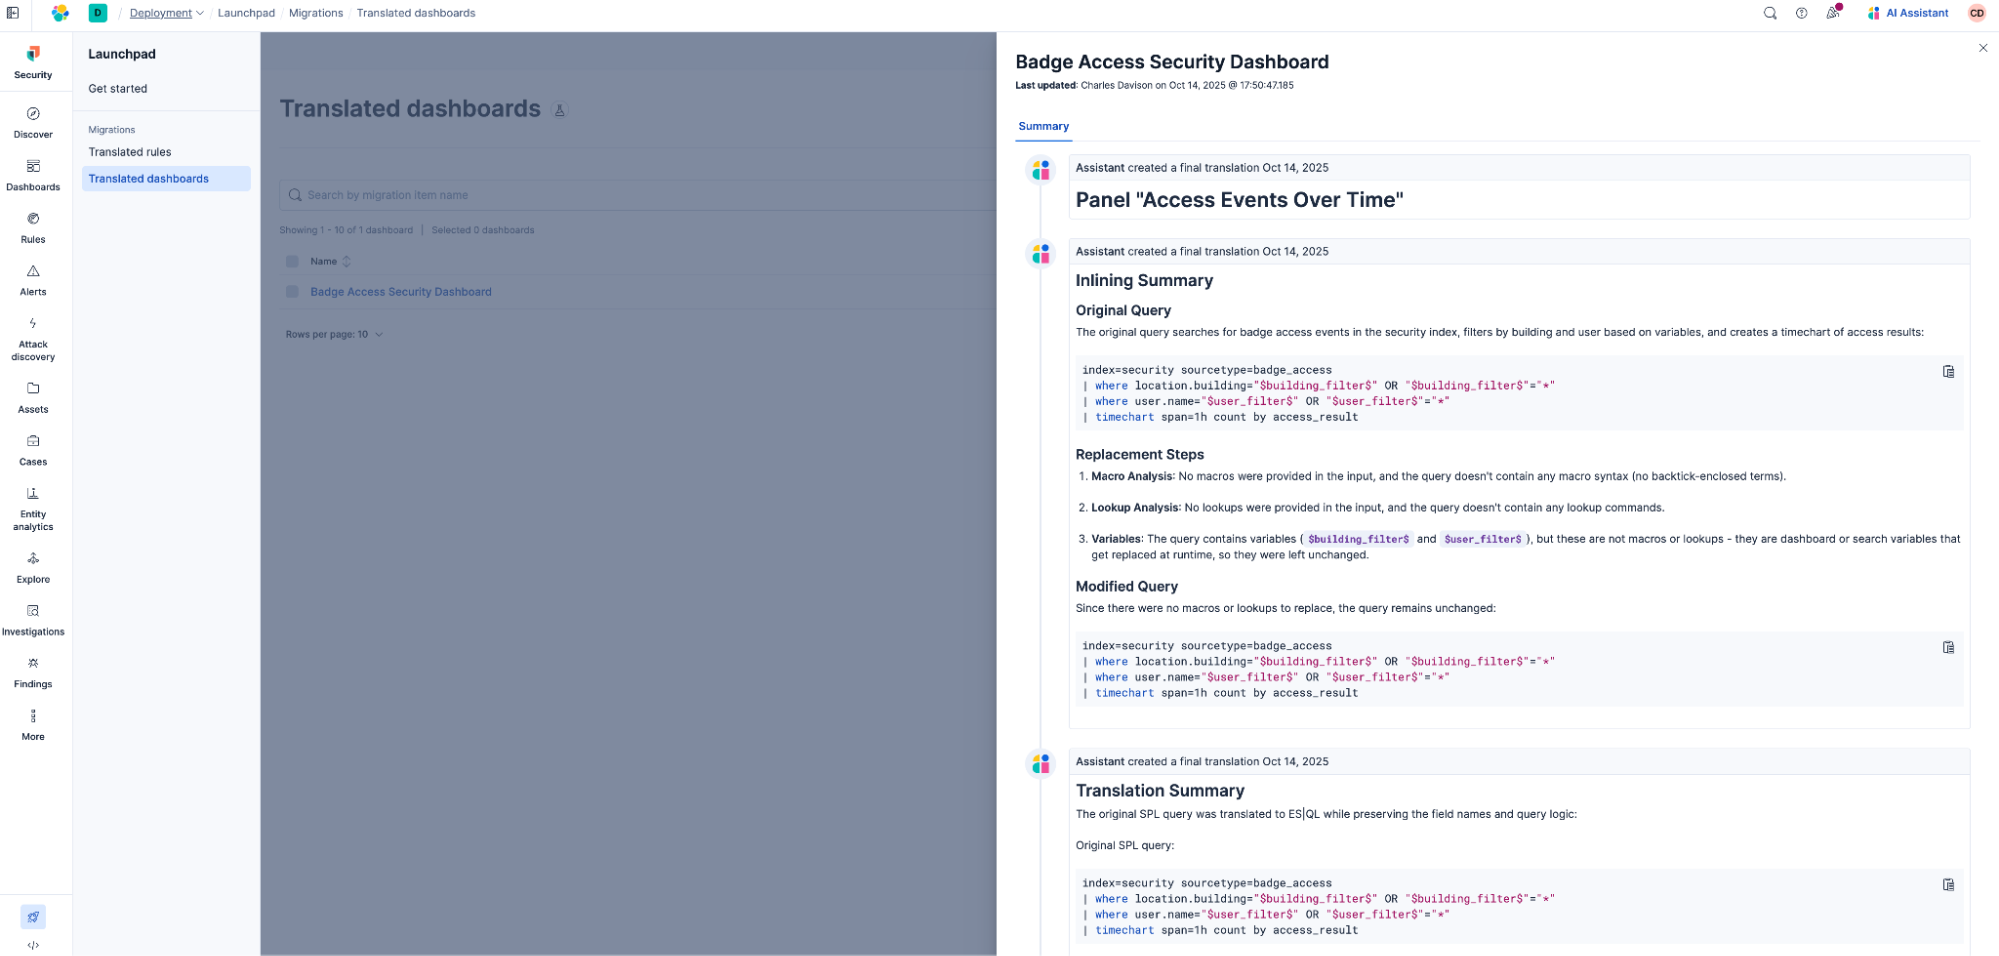
Once your dashboard is translated, the Summary tab gives you a peek under the hood. It outlines the rationale behind key decisions, such as field assignments and the use of specific Elasticsearch Query Language (ES|QL) commands, and highlights any missing macros or lookups. This transparency helps you validate the translated dashboards behavior and ensure alignment with your monitoring goals.
So, Automatic Migration for Dashboards is built to handle complexity while keeping your experience simple.
A closer look at dashboard translation
We’re sure you’re curious about what’s under the hood — and we’re happy to show you!
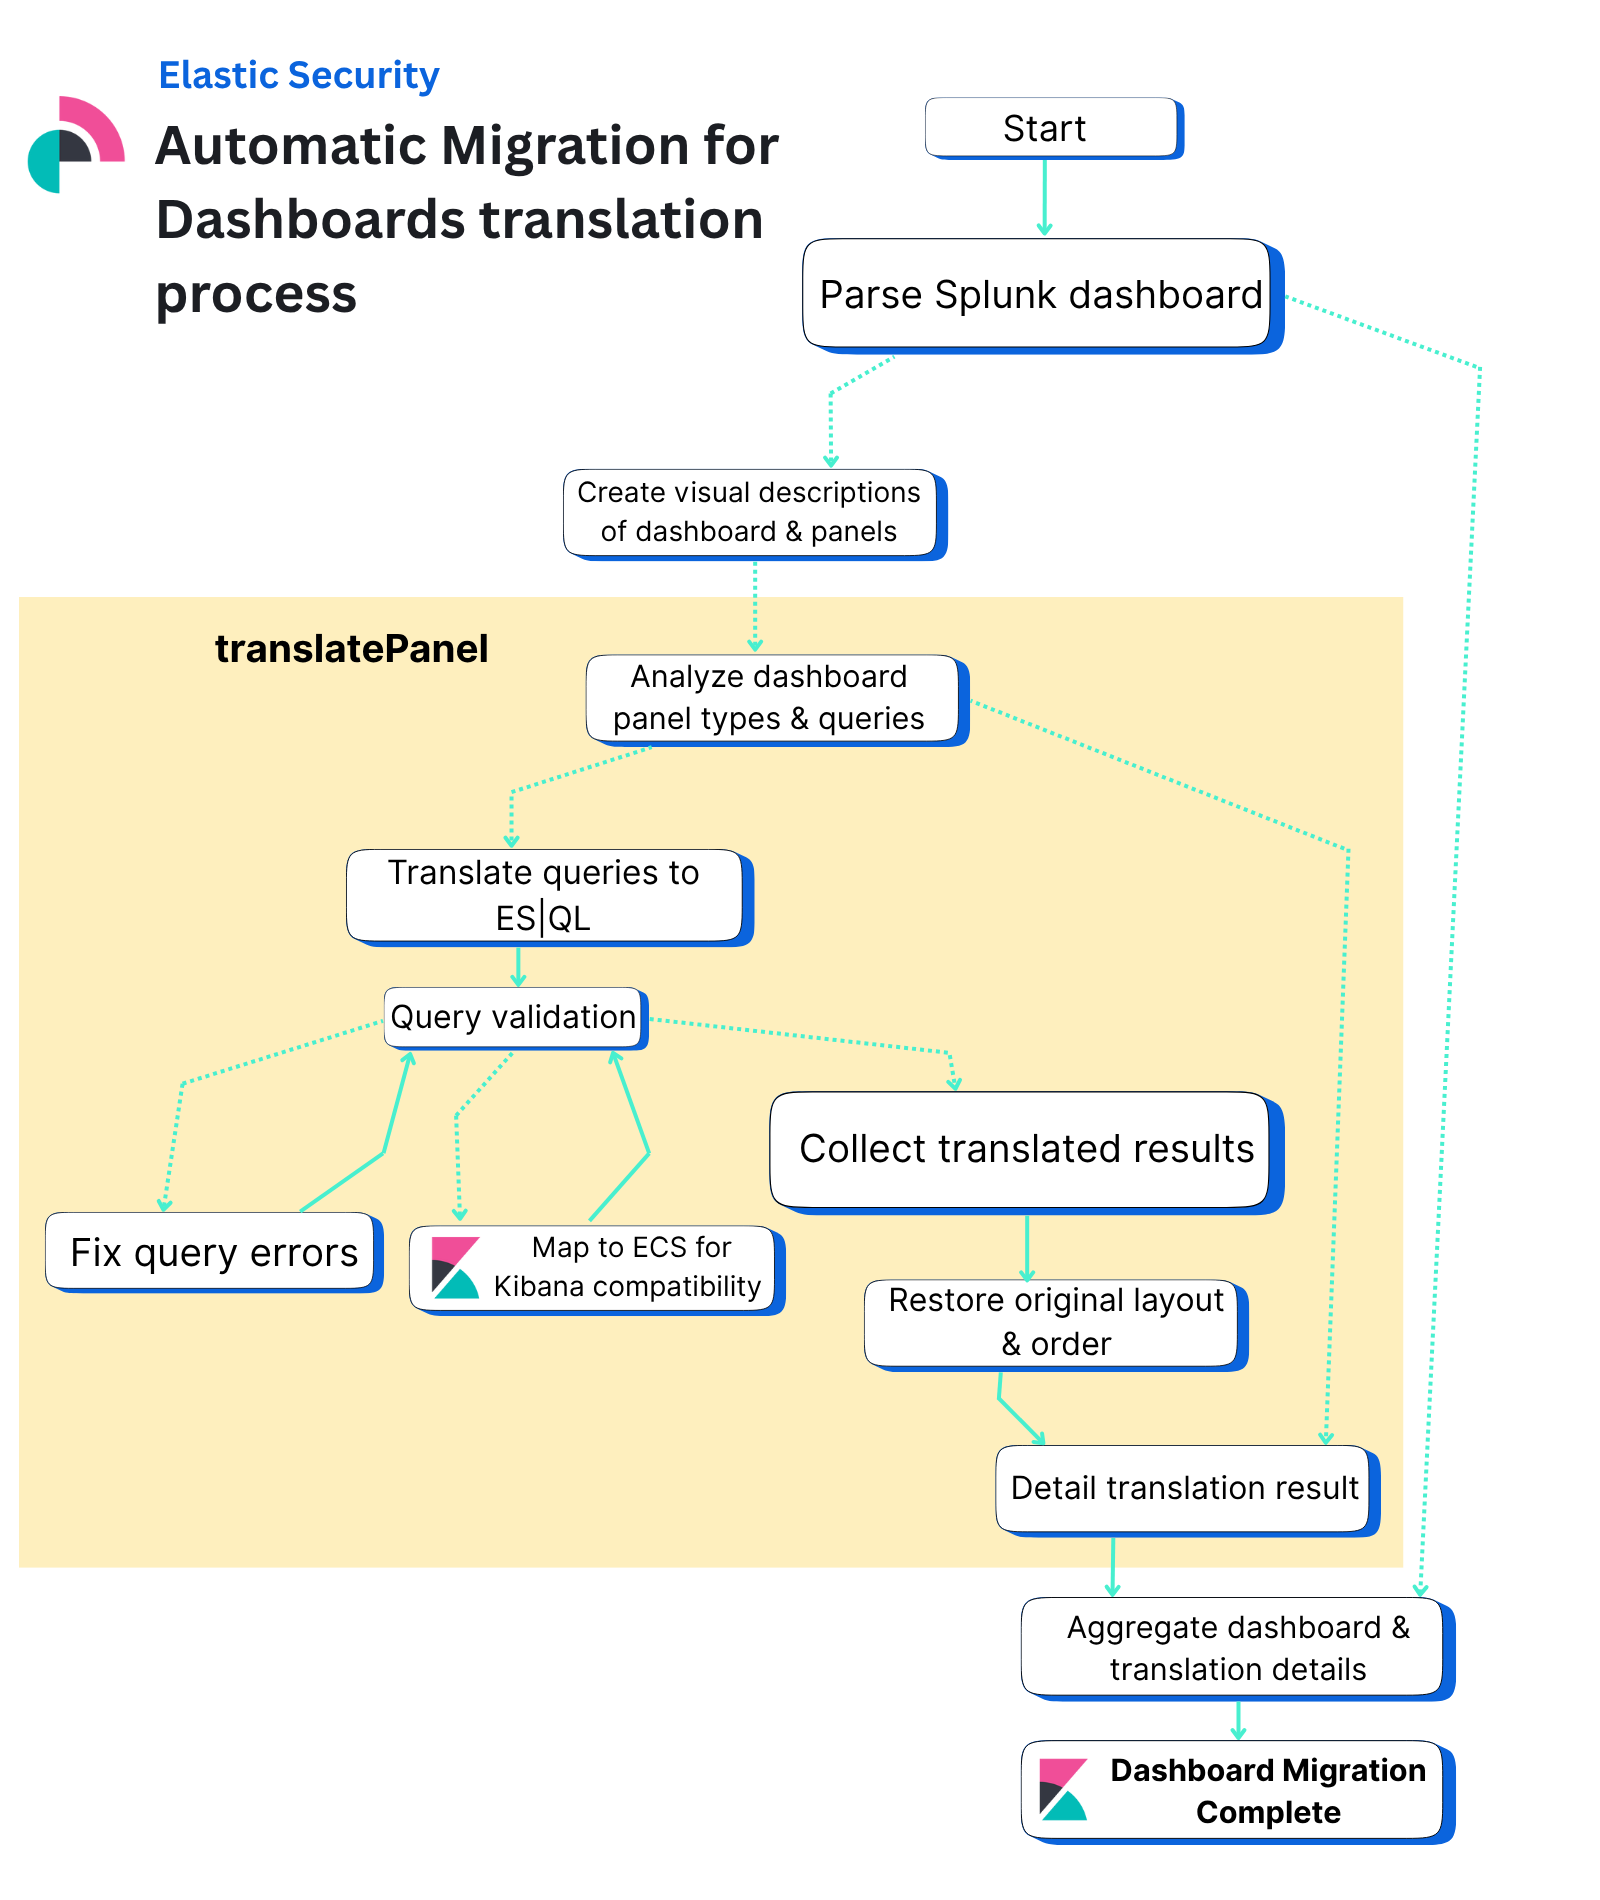
Let’s break down the flowchart above in 10 steps.
Parse original dashboard data: The migration process begins by parsing the original dashboard data from the source vendor (currently supporting Splunk), where the SplunkXmlDashboardParser extracts individual panels, queries, titles, and visualization types to create a structured representation of the dashboard.
Analyze parsed dashboard: The system uses a large language model (LLM) to analyze the parsed dashboard. This model then generates comprehensive descriptions for both the entire dashboard and each individual panel. These descriptions clarify what each panel visualizes, providing essential context for the subsequent translation process.
Translate each panel: The process then fans out to translate each panel in parallel, where individual panels are distributed to separate translation tasks. Each task then analyzes the panel’s visualization type and translates its query to ES|QL.
Use subgraphs: Each panel translation uses a subgraph to handle the complex conversion logic, transforming vendor-specific queries and visualizations into Kibana-compatible formats while gracefully handling errors by creating markdown panels with error messages when translation fails.
Return panels to main state: The translated panels are then fanned back into the main state, where the system collects all individual panel translation results and sorts them back to their original order to maintain the dashboard's intended layout.
Validate panels: The aggregation process validates that panels were fully or partially translated successfully. If all panels failed, the migration is aborted with appropriate error handling. Users can see why each panel failed in the translation summary of the dashboard.
Create Kibana dashboard object: The system then creates the final Kibana dashboard object using a predefined template for each type of visualization, setting the dashboard title, description, and panel configuration based on the translated content.
Determine overall translation result status: The process determines the overall translation result status by evaluating whether all panels were fully translated, partially translated, or untranslatable, providing clear feedback on the migration success.
Collect all comments: All comments from individual panel translations are aggregated together with headers for each panel providing detailed feedback about the translation process and any issues encountered.
- Assemble and deliver final dashboard: The final migrated dashboard is assembled, outputted, and ready for use in Kibana, completing the migration from the original vendor format to the Elasticsearch-compatible format.
Get started with Automatic Migration for Dashboards
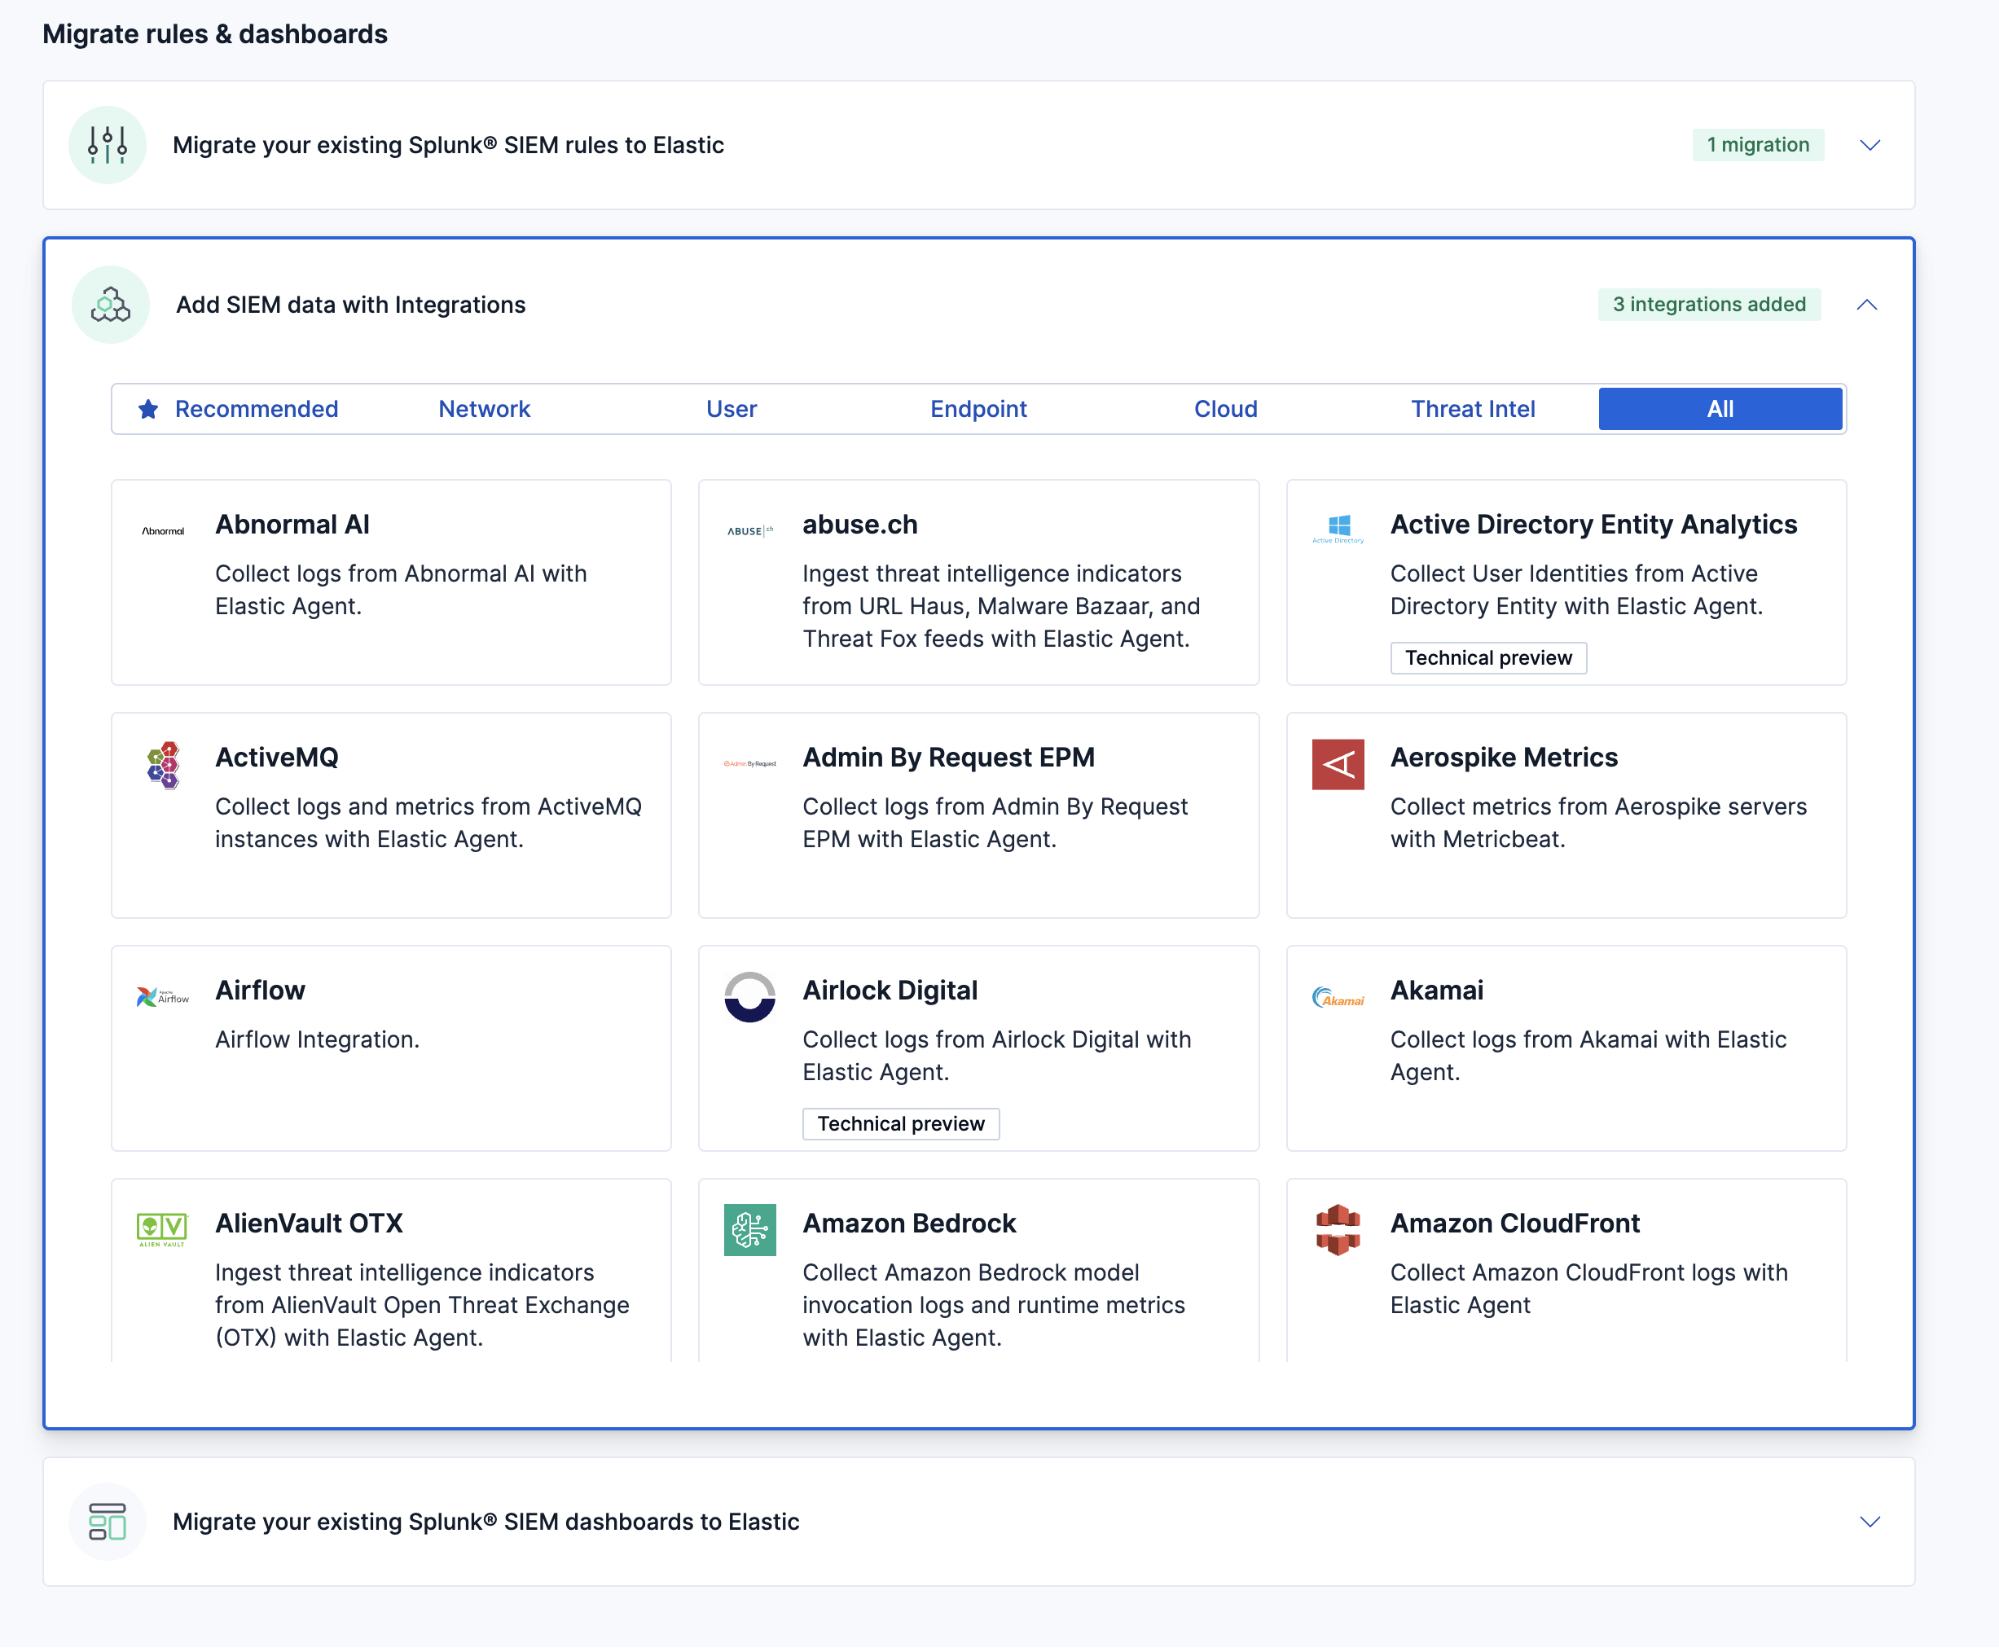
To get started with Automatic Migration for Dashboards, you can consider migrating your detection rules before your dashboards. Then, you can easily see your existing rules and how many map to Elastic integrations. Elastic will identify any integrations for which you have detection rules and display whether they are installed or not. This gives you simple visibility into what integrations you may need to complete your SIEM migration.
To further maximize your migration, we recommend you also onboard your SIEM data before uploading your existing dashboards. While this is an optional starting point, it can improve the review of your translated dashboards by displaying your actual data.
Tip: you can also use Automatic Import to quickly ingest any custom data sources.
After deciding on migrating your detection rules and data, try Automatic Migration for Dashboards in three simple steps:
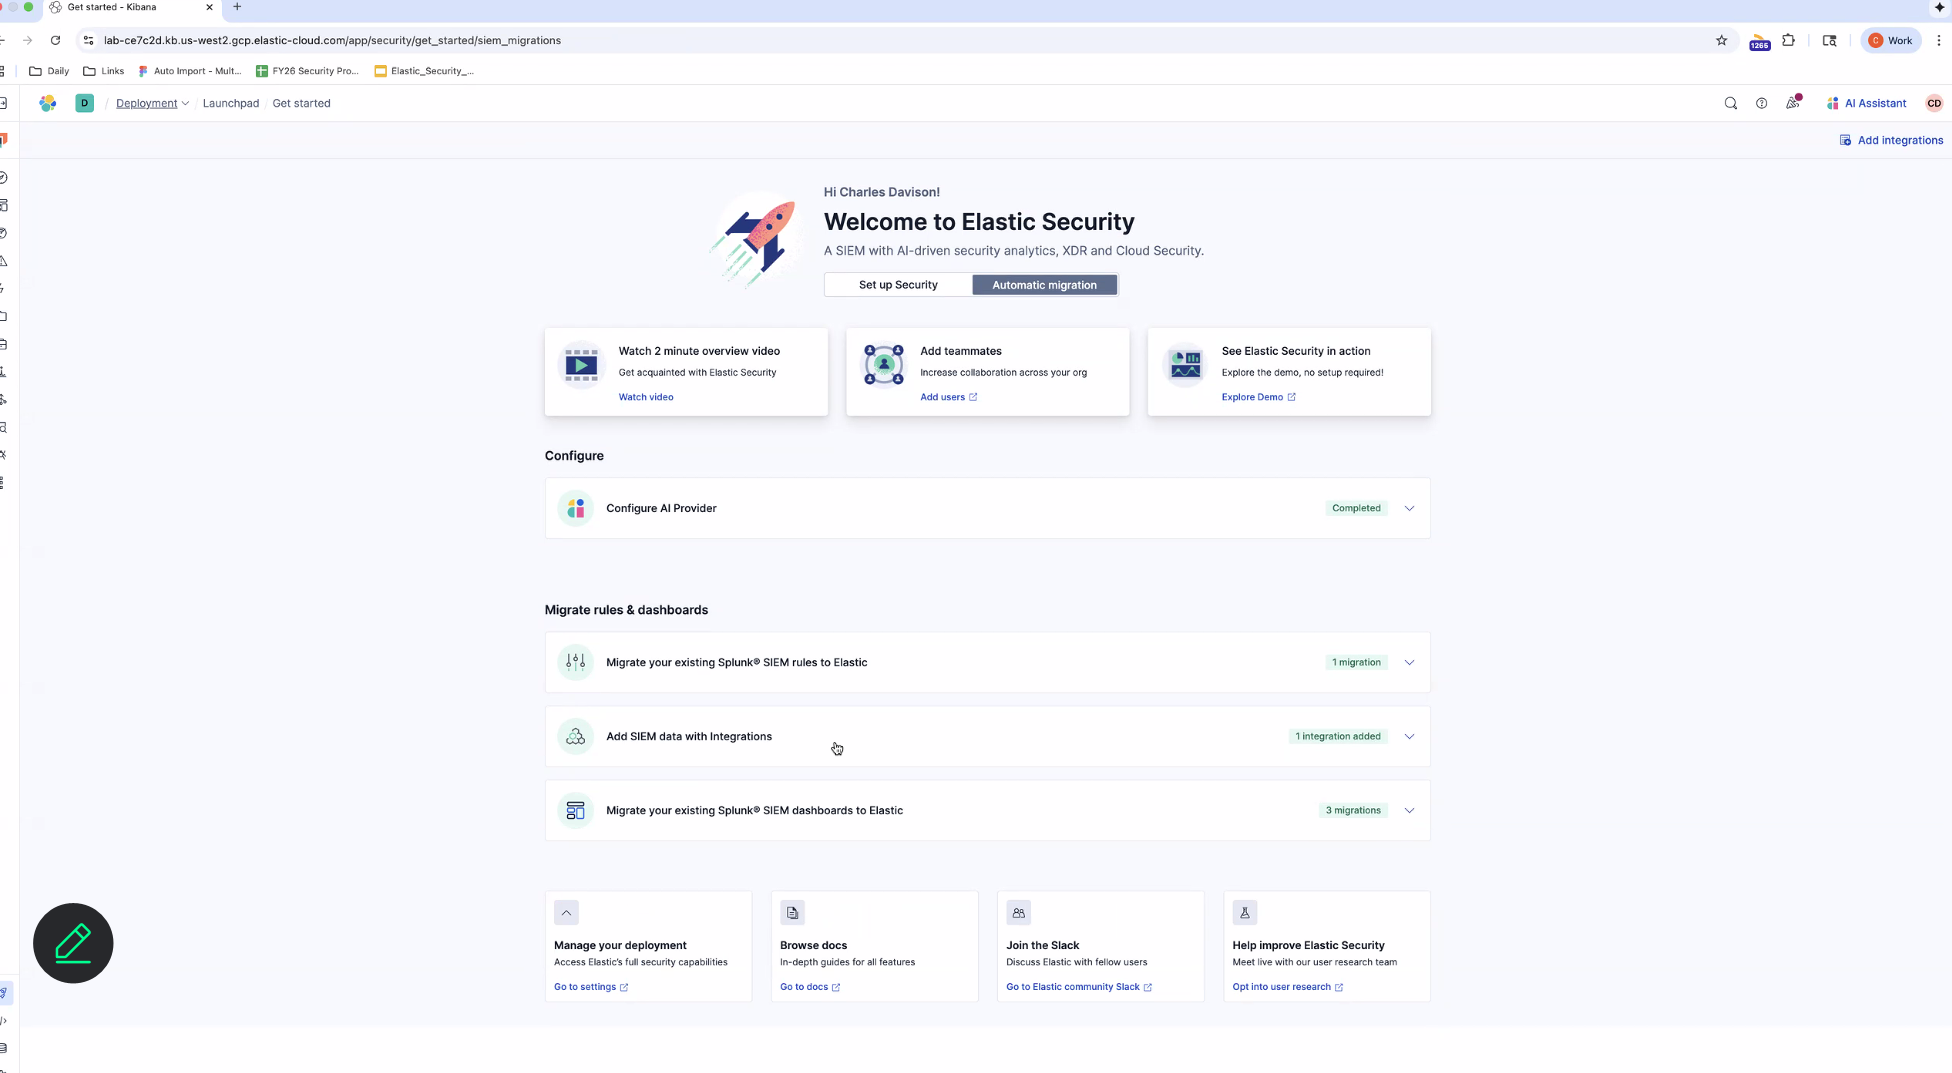
1. Navigate to Elastic Security’s “Get started” page.
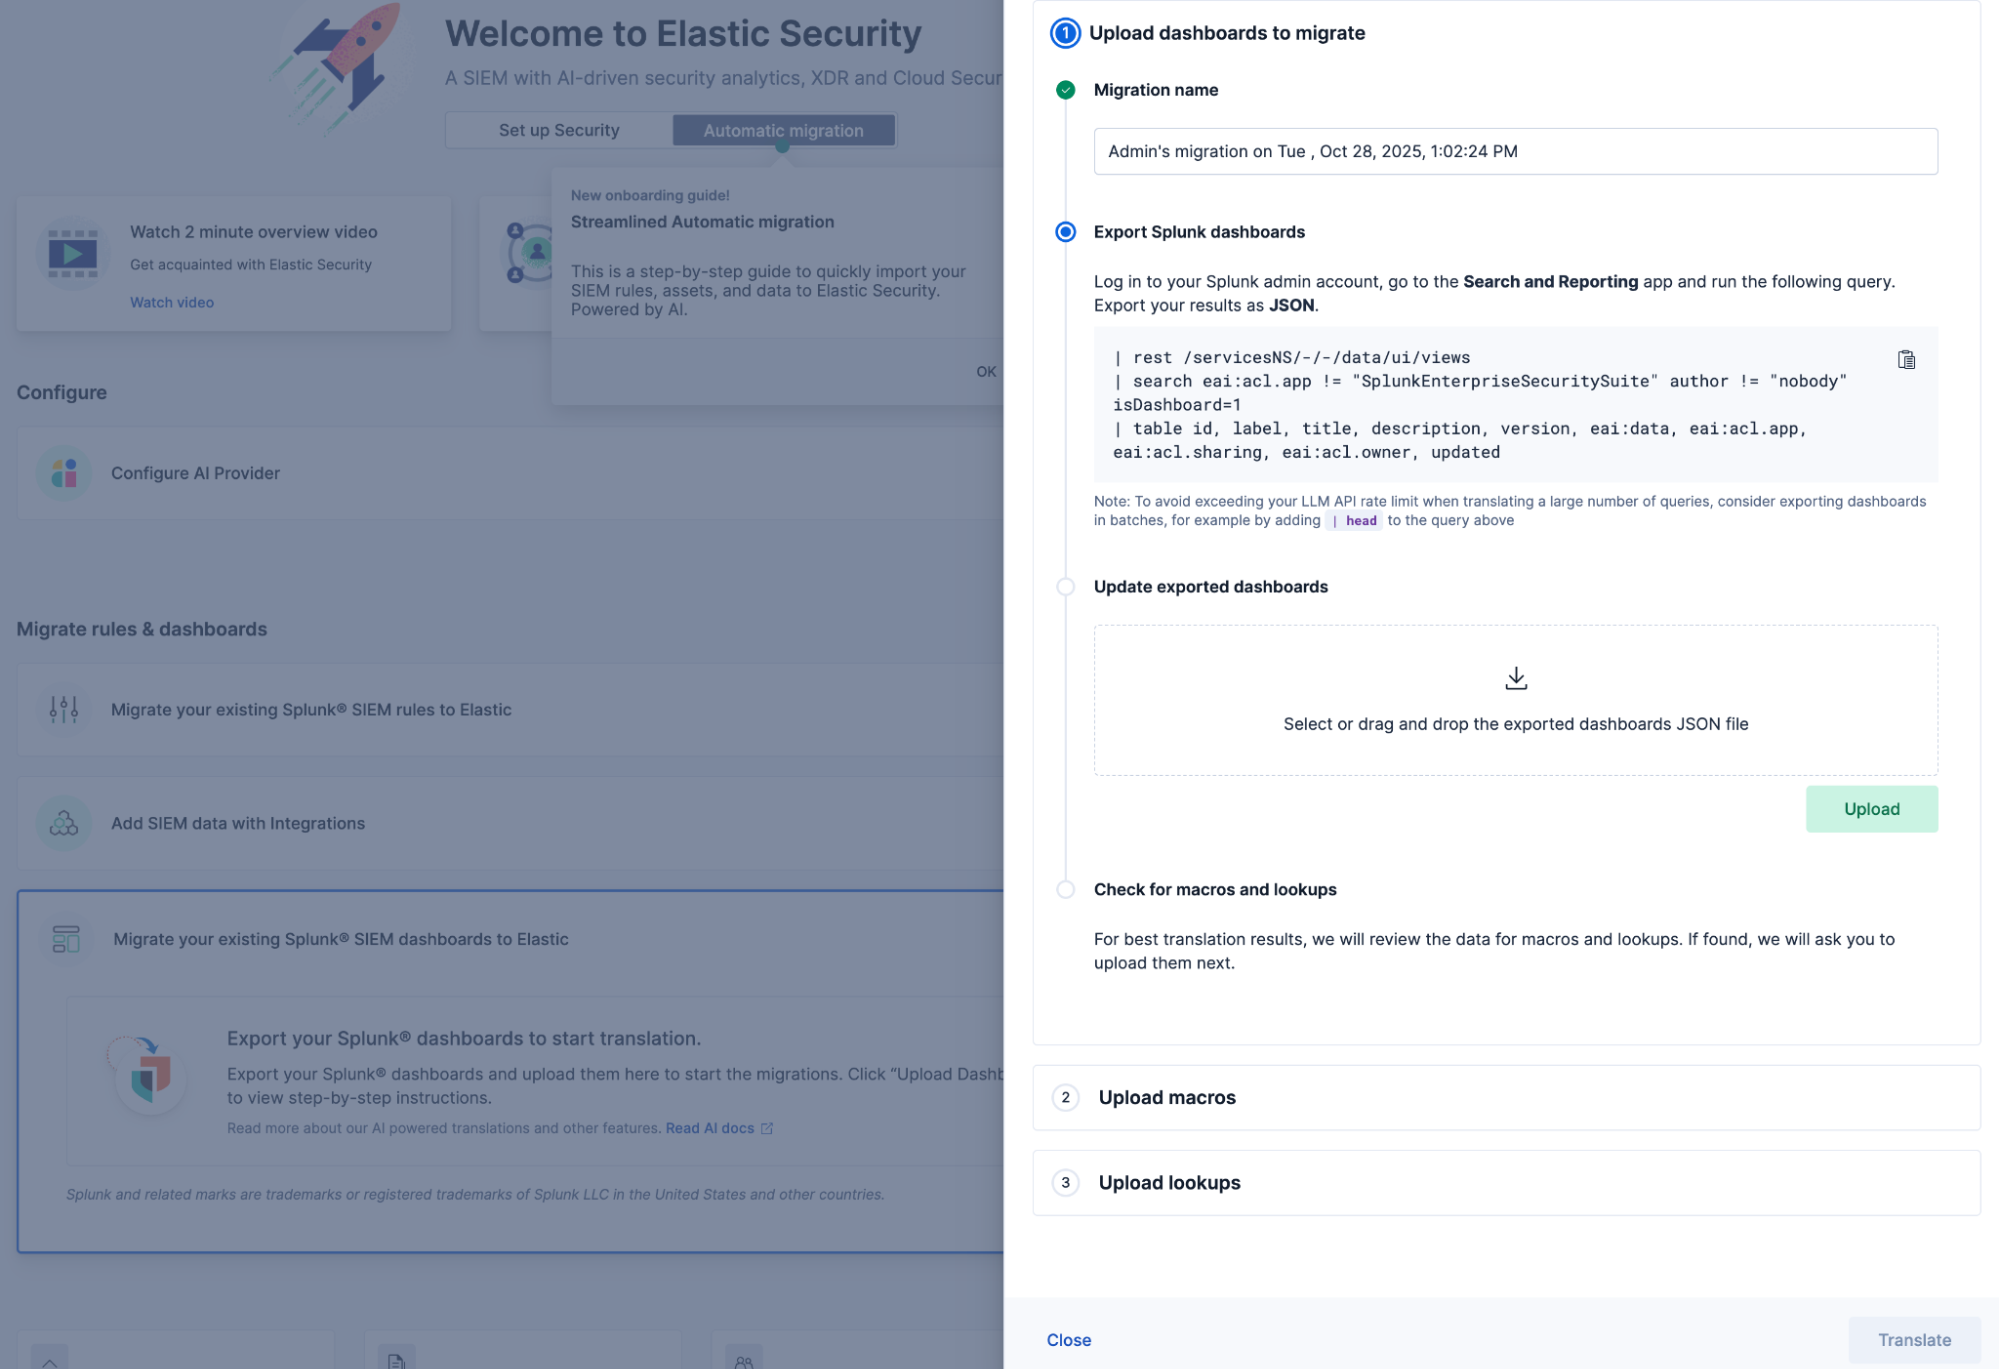
2. Let Elastic guide you through exporting your dashboards from Splunk and uploading them into Elastic Security. Elastic handles the finer details by scanning for references to macros and lookups and then prompts you to upload them when found.
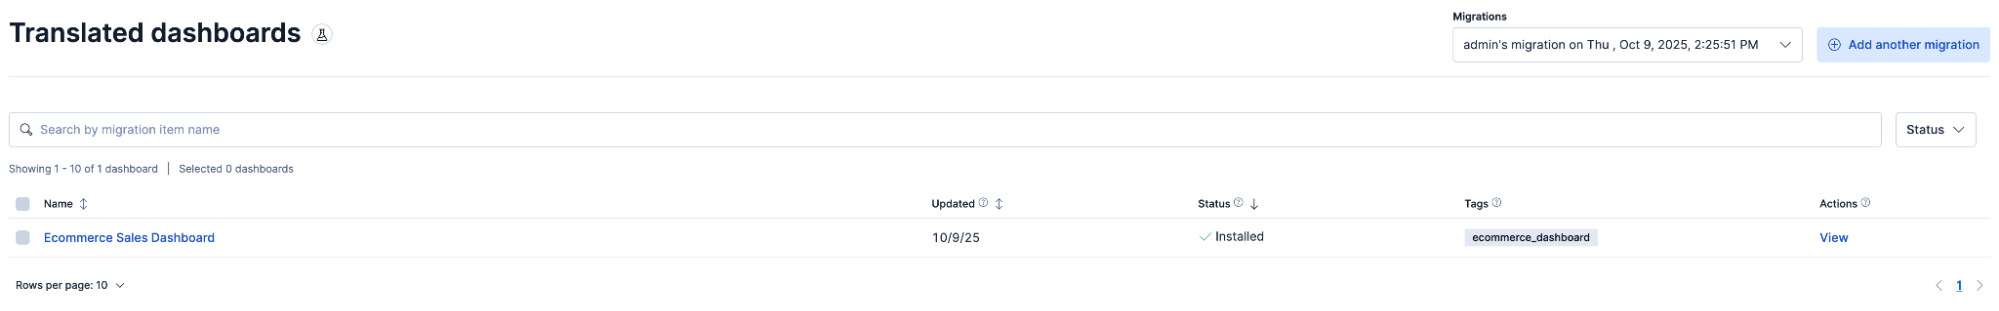
3. Once the dashboards are uploaded, you can view their status (Translated, Partially translated, or Not translated) to identify if you can install the dashboards to complete the migration.
While Partially translated dashboards require further user action, both Translated and Partially translated dashboards can be installed.
- Not translated dashboards could not be translated likely due to functional differences between the query languages or versions.
- For more information, refer to the technical documentation.
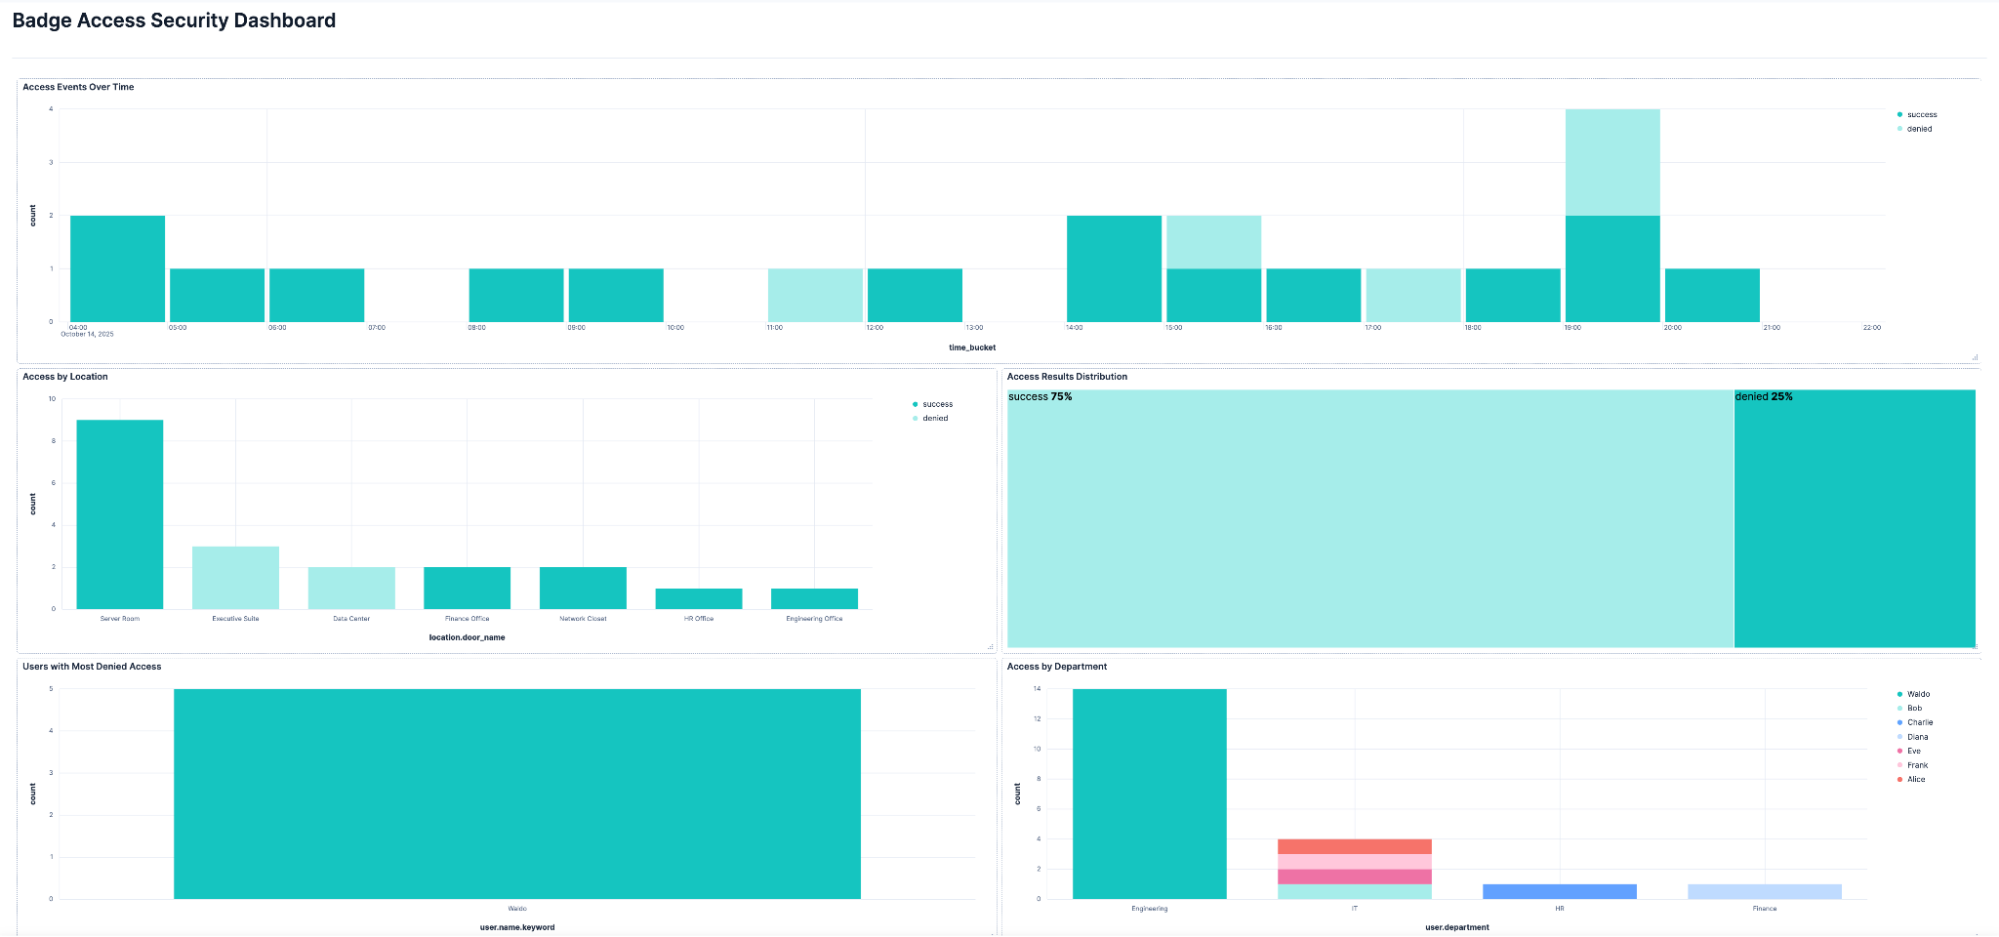
4. After reviewing and modifying any partially translated panels, the output is a functional dashboard that is viewable in Elastic Security.
How Elastic’s AI features aid SOC teams
Elastic Security brings generative AI into the SOC with retrieval augmented generation (RAG) and open agentic frameworks. Automatic Migration for Dashboards joins the lineup of Elastic Security’s powerful AI features helping SOC teams strengthen defenses across the IT environment:
Automatic Migration for Detection Rules complements Elastic’s deep library of prebuilt rules to broaden detection use case coverage.
Automatic Import extends visibility and powers detection rules by onboarding custom data sources in minutes.
Attack Discovery distills the alerts generated by detection rules to pinpoint advancing threats and suggest next steps.
Elastic AI Assistant guides analysts through investigation and response using natural language.
Elastic’s unified SIEM, XDR, and cloud security solution helps analysts detect earlier, investigate smarter, and hunt faster.
Migrate to Elastic Security today
We’re excited for you to begin using Automatic Migration to support your migration from Splunk to Elastic Security. Interested in testing Elastic Security first? Try it free, or get in touch.
Have feedback? Tell us what you think in the Elastic Community Slack channel or on the Elastic Security forum.
The release and timing of any features or functionality described in this post remain at Elastic's sole discretion. Any features or functionality not currently available may not be delivered on time or at all.
In this blog post, we may have used or referred to third party generative AI tools, which are owned and operated by their respective owners. Elastic does not have any control over the third party tools and we have no responsibility or liability for their content, operation or use, nor for any loss or damage that may arise from your use of such tools. Please exercise caution when using AI tools with personal, sensitive or confidential information. Any data you submit may be used for AI training or other purposes. There is no guarantee that information you provide will be kept secure or confidential. You should familiarize yourself with the privacy practices and terms of use of any generative AI tools prior to use.
Elastic, Elasticsearch, and associated marks are trademarks, logos or registered trademarks of Elasticsearch B.V. in the United States and other countries. All other company and product names are trademarks, logos or registered trademarks of their respective owners.
Share
- Share on Twitter
Share on Twitter
- Share on LinkedIn
Share on LinkedIn
- Share on Facebook
Share on Facebook
- Share by Email
Share by Email
- Print this page
Print