- Observability: other versions:
- What is Elastic Observability?
- What’s new in 8.6
- Send data to Elasticsearch
- Spin up the Elastic Stack
- Deploy Elastic Agent to send data
- Deploy Beats to send data
- Elastic Serverless Forwarder for AWS
- Deploy serverless forwarder
- Configuration options
- Troubleshooting
- Observability overview page
- Application performance monitoring (APM)
- Application logs
- Log monitoring
- Infrastructure monitoring
- Uptime and synthetic monitoring
- User Experience
- Alerting
- Cases
- CI/CD observability
- Troubleshooting
- Fields reference
- Tutorials
- Monitor Amazon Web Services (AWS) with Elastic Agent
- Monitor Amazon Web Services (AWS) with Beats
- Monitor Google Cloud Platform
- Monitor a Java application
- Monitor Kubernetes
- Monitor Microsoft Azure with Elastic Agent
- Monitor Microsoft Azure with the native Azure integration
- Monitor Microsoft Azure with Beats
Alerting
editAlerting
editMake sure alerting is already set up in Kibana. For details, see Setup and prerequisites.
Alerting enables you to detect complex conditions defined by a rule within the Logs, Infrastructure, Uptime, and APM apps. When a condition is met, the rule tracks it as an alert and responds by triggering one or more actions.
Alerts and rules related to Observability apps including Logs, Infrastructure, Uptime, and APM can be managed in the Observability UI. You can also manage Observability app rules alongside rules for other apps from the Kibana Management UI.
Create rules
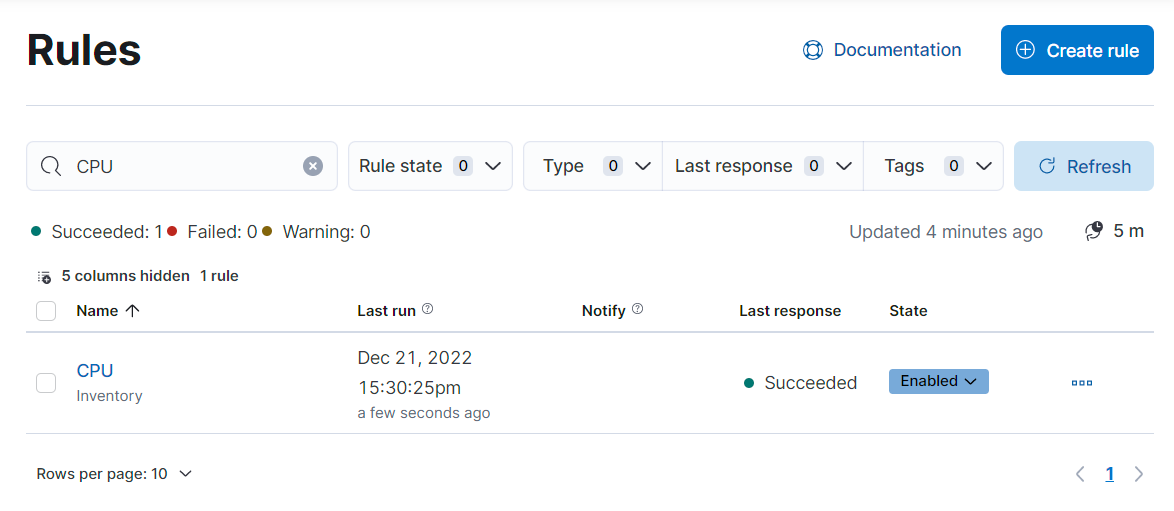
editThe first step when setting up alerts is to create a rule. To create and manage rules related to Observability apps, go to the Observability Alerts page and click Manage Rules to navigate to the Observability Rules page.
You can also create rules directly from the Logs, Infrastructure, Uptime, and APM apps without leaving the app by clicking Alerts and rules and selecting a rule, or you can select Manage Rules to go to the Observability Rules page.

You can also centrally create and manage rules, including rules not related to Observability, from the Kibana Management UI.
From the Observability Rules page, you can manage rules for Observability apps, including:
- Creating a new rule
- Editing or deleting existing rules
- Updating the status of existing rules (Enabled, Disabled, or Snoozed indefinitely)
The Observability Rules page allows you to set a rule to be "Snoozed indefinitely". To snooze a rule for a specific time period, you must use the centralized Rules page.
Extend your rules by connecting them to actions that use built-in connectors for email, IBM Resilient, Index, JIRA, Microsoft Teams, PagerDuty, Server log, ServiceNow ITSM, and Slack. Also supported is a powerful webhook output letting you tie into other third-party systems. Connectors allow actions to talk to these services and integrations.
Learn how to create specific types of rules:
View rule details
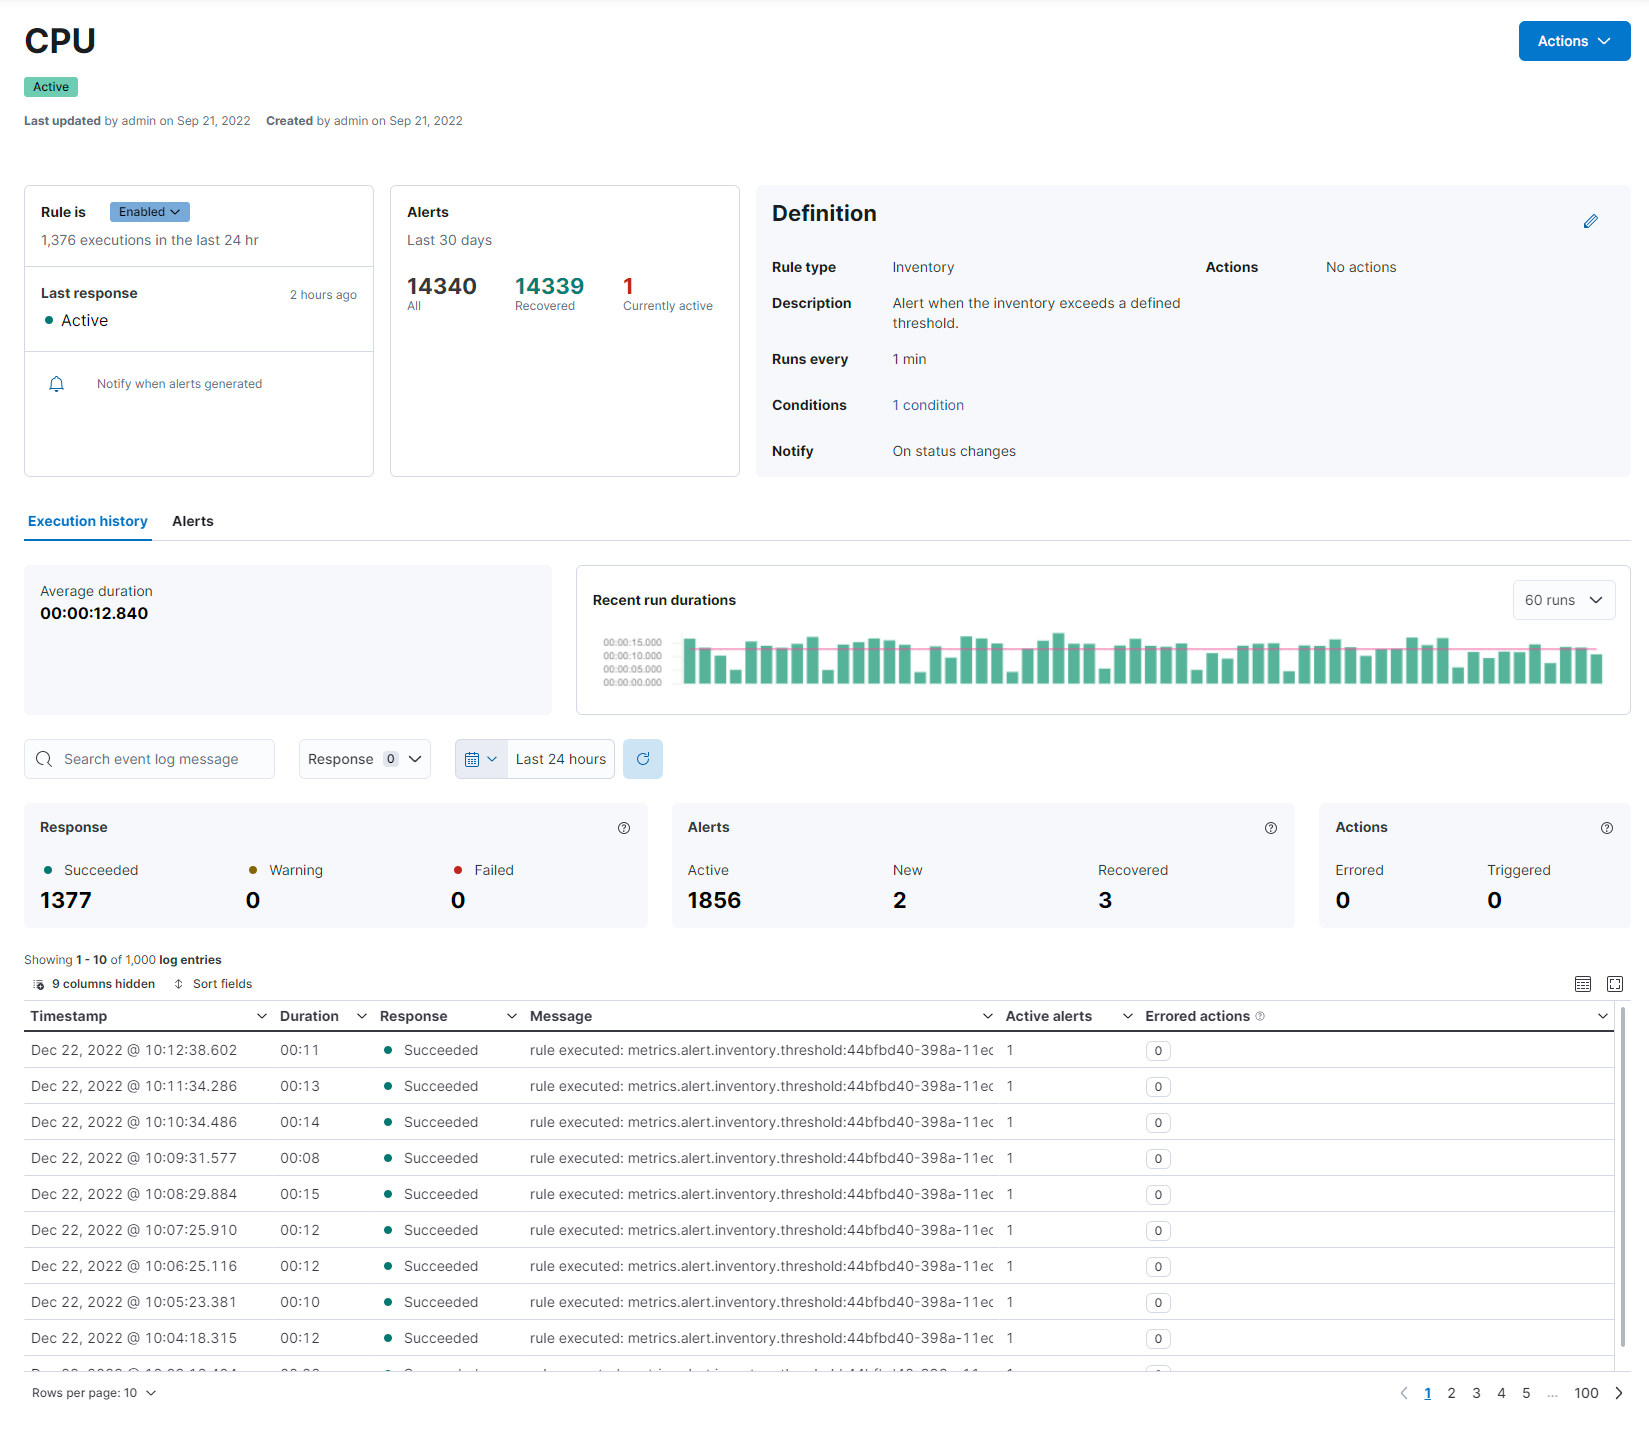
editClick on an individual rule on the Rules page to view details including the rule name, status, definition, execution history, related alerts, and more.

You can also view rule details by clicking on individual rules in the Kibana Management UI.
View and manage alerts
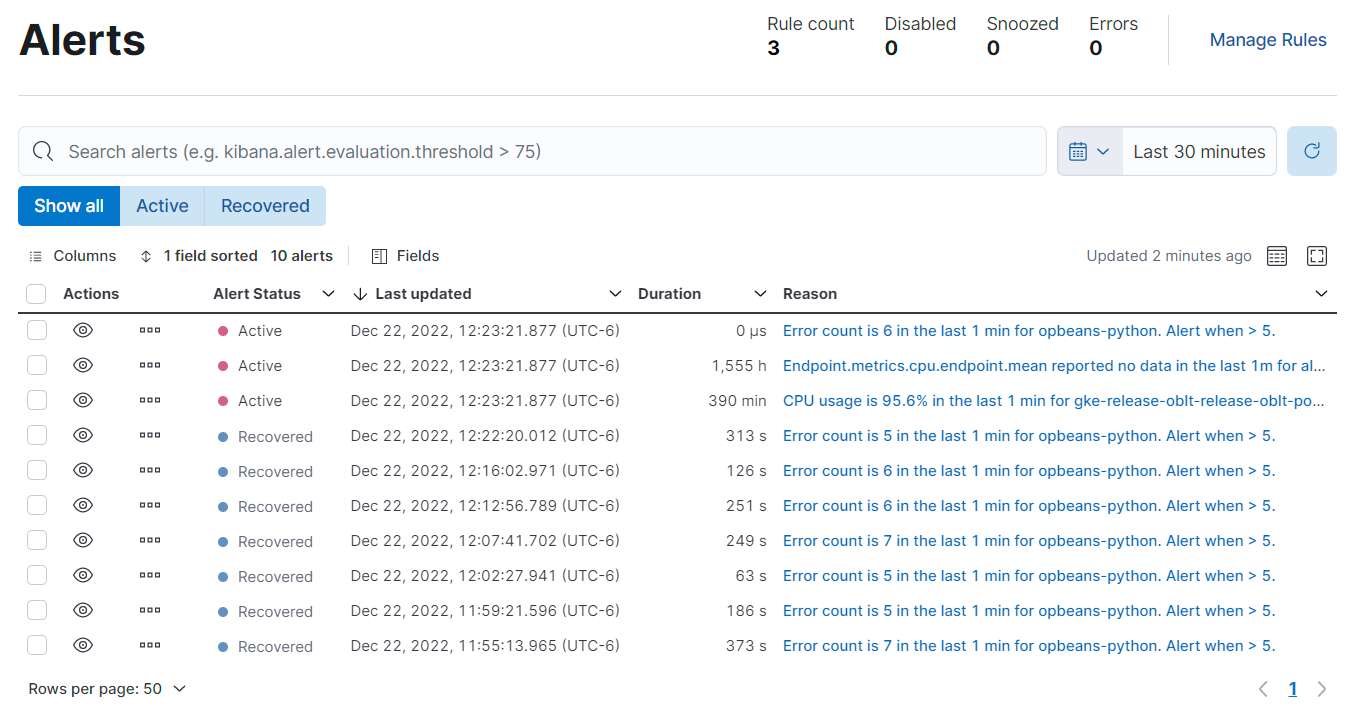
editThe Alerts page lists all your alerts that have met a condition defined by a rule you created using one of the Observability apps.
Learn more about viewing and managing alerts in View alerts.

Not all the predefined rules in Stack Management will generate and list an alert on the Observability Alerts page. Only alerts generated by rules relating to Logs, Infrastructure, Uptime, and APM can be viewed on the Alerts page.
Configure alerts
editYou may want to disable writing to specific Observability alert indices or disable all alerts and remove the Alerts page altogether. You can do this in Kibana settings.
If you are using our hosted Elasticsearch Service on Elastic Cloud, you’ll edit the Kibana user settings:
- Select your deployment on the home page, and from your deployment menu go to the Edit page.
- In the Kibana section, click Edit user settings, and add the desired settings (detailed below).
-
Click Back, and then click Save. The changes are automatically appended to the
kibana.ymlconfiguration file for your instance.
If you have a self-managed Elastic Stack, you’ll edit the settings in your kibana.yml file.
Disable writing to specific alert indices
editTo disable writing to specific Observability alerts-as-data indices
while continuing to write to others, use xpack.ruleRegistry.write.disabledRegistrationContexts.
You can disable writing to alert indices for:
-
Logs (
observability.logs) -
Infrastructure (
observability.metrics) -
APM (
observability.apm) -
Uptime (
observability.uptime)
Disabling writing to the indices of one of the Observability apps listed above will affect all rule types of the corresponding app. For example, disabling writing to uptime alert indices will affect all uptime rule types including monitor status and TLS rule types.
For example, to disable writing to Logs alert indices, you would add the following to your Kibana settings:
xpack.ruleRegistry.write.disabledRegistrationContexts : ['observability.logs']
To disable writing to both Logs and Uptime alert indices, you would use:
xpack.ruleRegistry.write.disabledRegistrationContexts : ['observability.logs', 'observability.uptime']
Remove the Alerts page
editTo disable writing to all alert indices and remove the Alerts page from Kibana altogether, use the following settings:
xpack.ruleRegistry.write.enabled: 'false'
xpack.observability.unsafe.alertingExperience.enabled: 'false'
On this page