- Kibana Guide: other versions:
- What is Kibana?
- What’s new in 8.14
- Kibana concepts
- Quick start
- Set up
- Install Kibana
- Configure Kibana
- Alerting and action settings
- APM settings
- Banners settings
- Cases settings
- Enterprise Search settings
- Fleet settings
- i18n settings
- Logging settings
- Logs settings
- Metrics settings
- Monitoring settings
- Reporting settings
- Search sessions settings
- Secure settings
- Security settings
- Spaces settings
- Task Manager settings
- Telemetry settings
- URL drilldown settings
- Start and stop Kibana
- Access Kibana
- Securing access to Kibana
- Add data
- Upgrade Kibana
- Configure security
- Configure reporting
- Configure logging
- Configure monitoring
- Command line tools
- Production considerations
- Discover
- Dashboard and visualizations
- Canvas
- Maps
- Build a map to compare metrics by country or region
- Track, visualize, and alert on assets in real time
- Map custom regions with reverse geocoding
- Heat map layer
- Tile layer
- Vector layer
- Plot big data
- Search geographic data
- Configure map settings
- Connect to Elastic Maps Service
- Import geospatial data
- Troubleshoot
- Reporting and sharing
- Machine learning
- Graph
- Alerting
- Observability
- Playground
- Security
- Dev Tools
- Fleet
- Osquery
- Stack Monitoring
- Stack Management
- REST API
- Get features API
- Kibana spaces APIs
- Kibana role management APIs
- User session management APIs
- Saved objects APIs
- Data views API
- Get all data views
- Get data view
- Create data view
- Update data view
- Delete data view
- Swap references preview
- Swap references
- Get default data view
- Set default data view
- Update data view fields metadata
- Get runtime field
- Create runtime field
- Upsert runtime field
- Update runtime field
- Delete runtime field
- Index patterns APIs
- Alerting APIs
- Action and connector APIs
- Cases APIs
- Add comment
- Create case
- Delete cases
- Delete comments
- Find case activity
- Find cases
- Find connectors
- Get alerts
- Get case activity
- Get case
- Get case status
- Get cases by alert
- Get comments
- Get configuration
- Get reporters
- Get tags
- Push case
- Set configuration
- Update cases
- Update comment
- Update configuration
- Import and export dashboard APIs
- Logstash configuration management APIs
- Machine learning APIs
- Osquery manager API
- Short URLs APIs
- Get Task Manager health
- Upgrade assistant APIs
- Synthetics APIs
- Uptime APIs
- Kibana plugins
- Troubleshooting
- Accessibility
- Release notes
- Kibana 8.14.3
- Kibana 8.14.2
- Kibana 8.14.1
- Kibana 8.14.0
- Kibana 8.13.4
- Kibana 8.13.3
- Kibana 8.13.2
- Kibana 8.13.1
- Kibana 8.13.0
- Kibana 8.12.2
- Kibana 8.12.1
- Kibana 8.12.0
- Kibana 8.11.4
- Kibana 8.11.3
- Kibana 8.11.2
- Kibana 8.11.1
- Kibana 8.11.0
- Kibana 8.10.4
- Kibana 8.10.3
- Kibana 8.10.2
- Kibana 8.10.1
- Kibana 8.10.0
- Kibana 8.9.2
- Kibana 8.9.1
- Kibana 8.9.0
- Kibana 8.8.2
- Kibana 8.8.1
- Kibana 8.8.0
- Kibana 8.7.1
- Kibana 8.7.0
- Kibana 8.6.1
- Kibana 8.6.0
- Kibana 8.5.2
- Kibana 8.5.1
- Kibana 8.5.0
- Kibana 8.4.3
- Kibana 8.4.2
- Kibana 8.4.1
- Kibana 8.4.0
- Kibana 8.3.3
- Kibana 8.3.2
- Kibana 8.3.1
- Kibana 8.3.0
- Kibana 8.2.3
- Kibana 8.2.2
- Kibana 8.2.1
- Kibana 8.2.0
- Kibana 8.1.3
- Kibana 8.1.2
- Kibana 8.1.1
- Kibana 8.1.0
- Kibana 8.0.0
- Kibana 8.0.0-rc2
- Kibana 8.0.0-rc1
- Kibana 8.0.0-beta1
- Kibana 8.0.0-alpha2
- Kibana 8.0.0-alpha1
- Developer guide
Maps
editMaps
editCreate beautiful maps from your geographical data. With Maps, you can:
- Build maps with multiple layers and indices.
- Animate spatial temporal data.
- Upload GeoJSON files and shapefiles.
- Embed your map in dashboards.
- Symbolize features using data values.
- Focus on only the data that’s important to you.
Build maps with multiple layers and indices
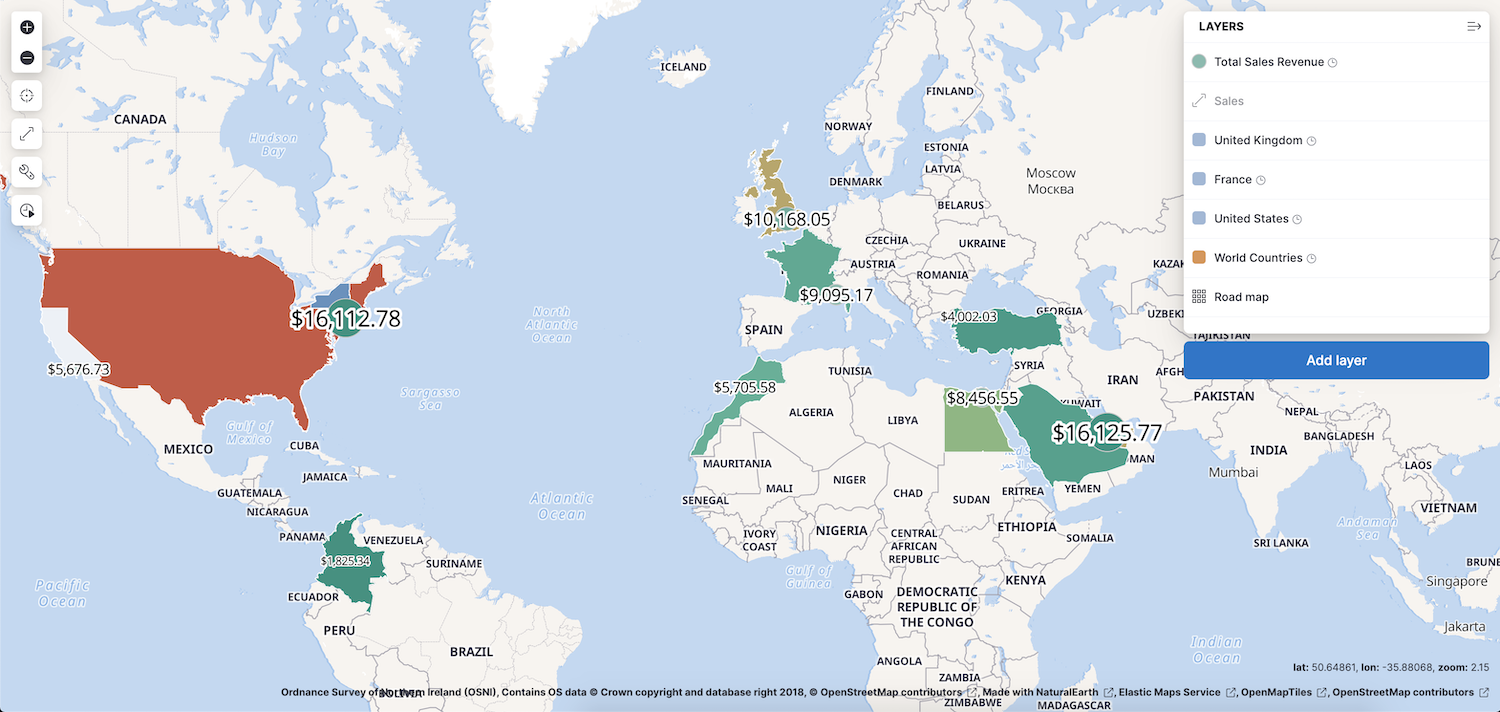
editUse multiple layers and indices to show all your data in a single map. Show how data sits relative to physical features like weather patterns, human-made features like international borders, and business-specific features like sales regions. Plot individual documents or use aggregations to plot any data set, no matter how large.

Animate spatial temporal data
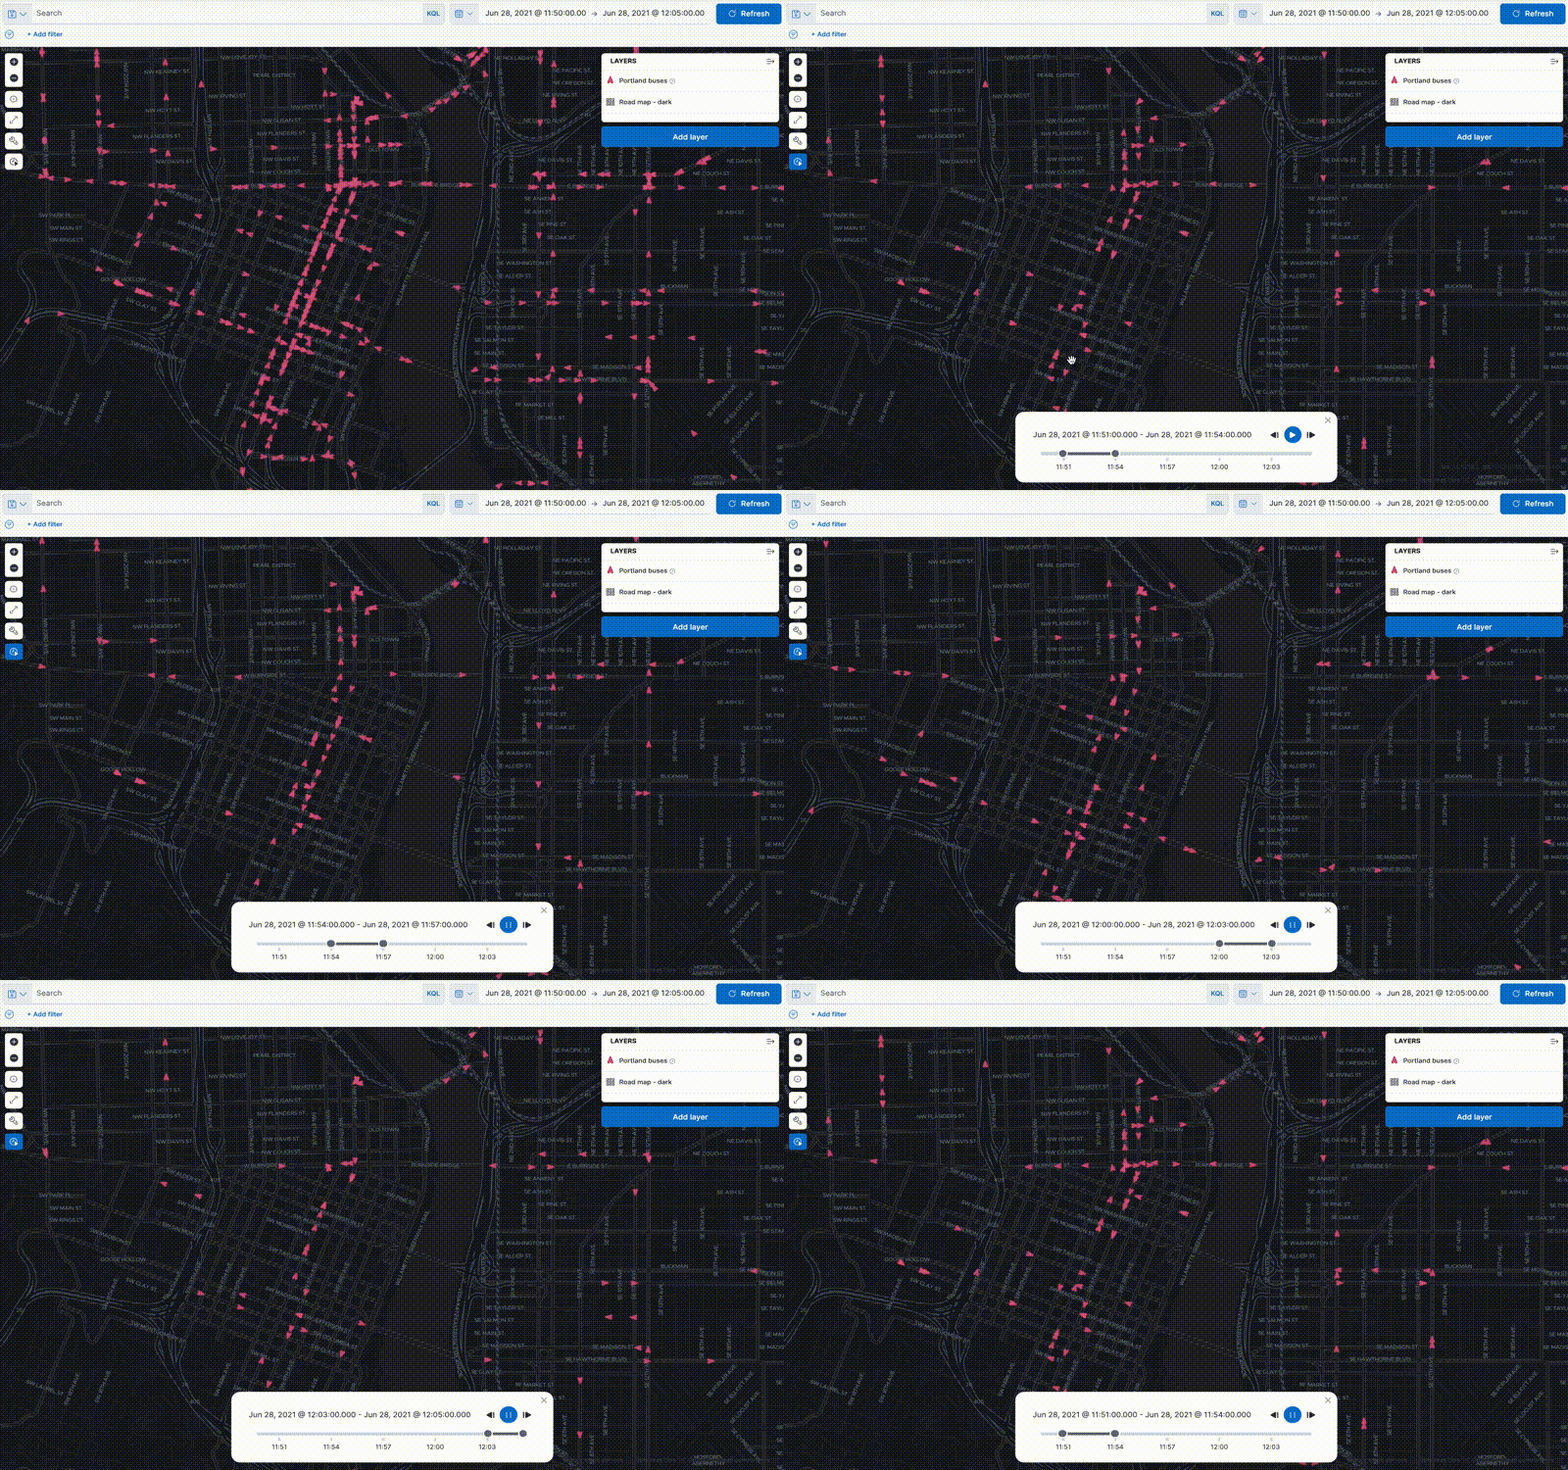
editData comes to life with animation. Hard to detect patterns in static data pop out with movement. Use time slider to animate your data and gain deeper insights.
This animated map uses the time slider to show Portland buses over a period of 15 minutes. The routes come alive as the bus locations update with time.

Upload GeoJSON files and shapefiles
editUse Maps to drag and drop your GeoJSON and shapefile data into Elasticsearch, and then use them as layers in your map.
Embed your map in dashboards
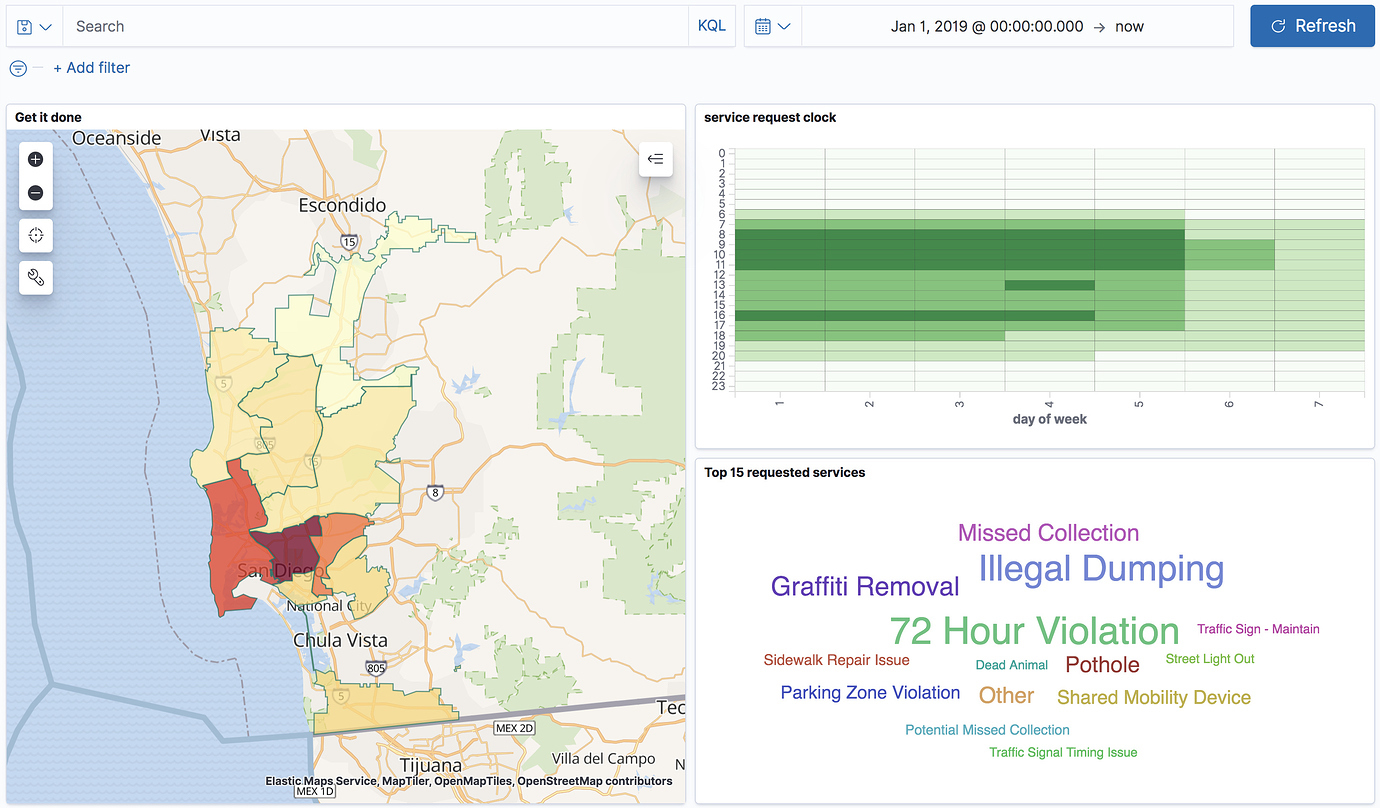
editViewing data from different angles provides better insights. Dimensions that are obscured in one visualization might be illuminated in another. Add your map to a dashboard and view your geospatial data alongside bar charts, pie charts, tag clouds, and more.
This choropleth map shows the density of non-emergency service requests in San Diego by council district. The map is embedded in a dashboard, so users can better understand when services are requested and gain insight into the top requested services.

Symbolize features using data values
editCustomize each layer to highlight meaningful dimensions in your data. For example, use dark colors to symbolize areas with more web log traffic, and lighter colors to symbolize areas with less traffic.
Focus on only the data that’s important to you
editSearch across the layers in your map to focus on just the data you want. Combine free text search with field-based search using the Kibana Query Language. Set the time filter to restrict layers by time. Draw a polygon on the map or use the shape from features to create spatial filters. Filter individual layers to compares facets.
On this page