- Packetbeat Reference: other versions:
- Packetbeat overview
- Quick start: installation and configuration
- Set up and run
- Upgrade Packetbeat
- Configure
- Traffic sniffing
- Network flows
- Protocols
- Processes
- General settings
- Project paths
- Output
- Kerberos
- SSL
- Index lifecycle management (ILM)
- Elasticsearch index template
- Kibana endpoint
- Kibana dashboards
- Processors
- Define processors
- add_cloud_metadata
- add_cloudfoundry_metadata
- add_docker_metadata
- add_fields
- add_host_metadata
- add_id
- add_kubernetes_metadata
- add_labels
- add_locale
- add_observer_metadata
- add_process_metadata
- add_tags
- community_id
- convert
- copy_fields
- decode_base64_field
- decode_json_fields
- decompress_gzip_field
- dissect
- dns
- drop_event
- drop_fields
- extract_array
- fingerprint
- include_fields
- registered_domain
- rename
- translate_sid
- truncate_fields
- urldecode
- Internal queue
- Logging
- HTTP endpoint
- Instrumentation
- packetbeat.reference.yml
- How to guides
- Exported fields
- AMQP fields
- Beat fields
- Cassandra fields
- Cloud provider metadata fields
- Common fields
- DHCPv4 fields
- DNS fields
- Docker fields
- ECS fields
- Flow Event fields
- Host fields
- HTTP fields
- ICMP fields
- Jolokia Discovery autodiscover provider fields
- Kubernetes fields
- Memcache fields
- MongoDb fields
- MySQL fields
- NFS fields
- PostgreSQL fields
- Process fields
- Raw fields
- Redis fields
- SIP fields
- Thrift-RPC fields
- Detailed TLS fields
- Transaction Event fields
- Measurements (Transactions) fields
- Monitor
- Secure
- Visualize Packetbeat data in Kibana
- Troubleshoot
- Get help
- Debug
- Record a trace
- Common problems
- Dashboard in Kibana is breaking up data fields incorrectly
- Packetbeat doesn’t see any packets when using mirror ports
- Packetbeat can’t capture traffic from Windows loopback interface
- Packetbeat is missing long running transactions
- Packetbeat isn’t capturing MySQL performance data
- Packetbeat uses too much bandwidth
- Error loading config file
- Found unexpected or unknown characters
- Logstash connection doesn’t work
- Publishing to Logstash fails with "connection reset by peer" message
- @metadata is missing in Logstash
- Not sure whether to use Logstash or Beats
- SSL client fails to connect to Logstash
- Monitoring UI shows fewer Beats than expected
- Dashboard could not locate the index-pattern
- Fields show up as nested JSON in Kibana
- Contribute to Beats
Enrich events with geoIP information
editEnrich events with geoIP information
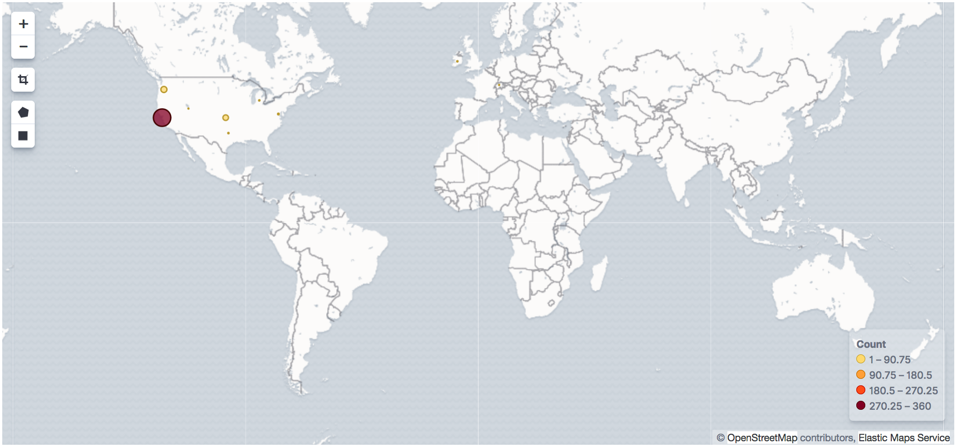
editTo populate the client locations map in the Packetbeat dashboard, follow the steps in this section.
You can use Packetbeat along with the GeoIP Processor in Elasticsearch to export geographic location information based on IP addresses. Then you can use this information to visualize the location of IP addresses on a map in Kibana.
The geoip processor adds information about the geographical location of
IP addresses, based on data from the Maxmind GeoLite2 City Database. Because the
processor uses a geoIP database that’s installed on Elasticsearch, you don’t need
to install a geoIP database on the machines running Packetbeat.
If your use case involves using Logstash, you can use the
GeoIP filter available in Logstash
instead of using the geoip processor. However, using the geoip processor is
the simplest approach when you don’t require the additional processing power of
Logstash.
Configure the geoip processor
editTo configure Packetbeat and the geoip processor:
-
Define an ingest node pipeline that uses one or more
geoipprocessors to add location information to the event. For example, you can use the Console in Kibana to create the following pipeline:PUT _ingest/pipeline/geoip-info { "description": "Add geoip info", "processors": [ { "geoip": { "field": "client.ip", "target_field": "client.geo", "ignore_missing": true } }, { "geoip": { "field": "source.ip", "target_field": "source.geo", "ignore_missing": true } }, { "geoip": { "field": "destination.ip", "target_field": "destination.geo", "ignore_missing": true } }, { "geoip": { "field": "server.ip", "target_field": "server.geo", "ignore_missing": true } }, { "geoip": { "field": "host.ip", "target_field": "host.geo", "ignore_missing": true } } ] }
In this example, the pipeline ID is
geoip-info.fieldspecifies the field that contains the IP address to use for the geographical lookup, andtarget_fieldis the field that will hold the geographical information."ignore_missing": trueconfigures the pipeline to continue processing when it encounters an event that doesn’t have the specified field.See GeoIP Processor for more options.
To learn more about adding host information to an event, see add_host_metadata.
-
In the Packetbeat config file, configure the Elasticsearch output to use the pipeline. Specify the pipeline ID in the
pipelineoption underoutput.elasticsearch. For example:output.elasticsearch: hosts: ["localhost:9200"] pipeline: geoip-info
-
Run Packetbeat. Remember to use
sudoif the config file is owned by root../packetbeat -e
If the lookups succeed, the events are enriched with
geo_pointfields, such asclient.geo.locationandhost.geo.location, that you can use to populate visualizations in Kibana.
As a convenience, the Packetbeat index template already has mappings defined
for client.geo.location, source.geo.location, destination.geo.location,
server.geo.location, and host.geo.location. The mappings ensure that each
field, when it exists, gets indexed as a geo_point.
If you add a field that’s not already defined as a geo_point in the
index template, add a mapping so the field gets indexed correctly.
Visualize locations
editTo visualize the location of IP addresses, you can
set up the example Kibana dashboards (if
you haven’t already), or
create a new coordinate map in Kibana and select the
location field, for example client.geo.location or host.geo.location, as
the Geohash.

On this page