WARNING: Version 5.0 of the Elastic Stack has passed its EOL date.
This documentation is no longer being maintained and may be removed. If you are running this version, we strongly advise you to upgrade. For the latest information, see the current release documentation.
Getting Started
editGetting Started
editMonitoring is automatically enabled when you install X-Pack into Elasticsearch and Kibana. By default, the monitoring agents index data within the same cluster.
If you send data to a separate monitoring cluster, the information is accessible even if the cluster you’re monitoring is not. You can send data from multiple clusters to the same monitoring cluster and view them all through the same instance of Kibana.
To view and analyze cluster, index, node, and Kibana metrics:
-
Open Kibana in your web browser and log in. If you are running Kibana
locally, go to
http://localhost:5601/. To access Kibana and view the monitoring dashboards, you need thekibana_userandmonitoring_userroles. - Click Monitoring in the side navigation to view the clusters being monitored:
Cluster Overview
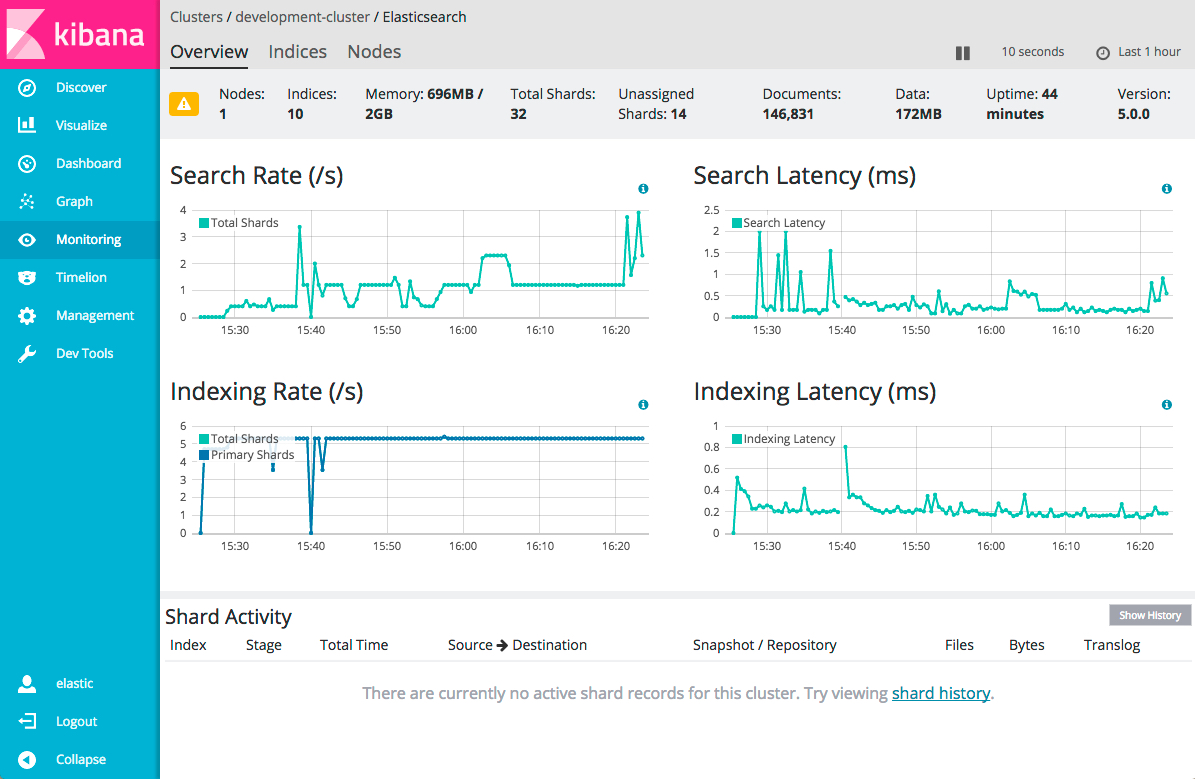
editTo view the key metrics that indicate the overall health of an Elasticsearch cluster, click Overview in the Elasticsearch section. Anything that needs your attention is highlighted in yellow or red.
Did you know that you can also set up watches to alert you when the status of your cluster changes? To learn how, see Watch Your Cluster Health.
The panel at the top shows the current cluster stats, the charts show the search and indexing performance over time, and the table at the bottom shows information about any shards that are being recovered.
Not sure what a chart is showing? Click the info button for a description of the metrics.
From there, you can dive into detailed metrics for particular nodes and indices.
Indices
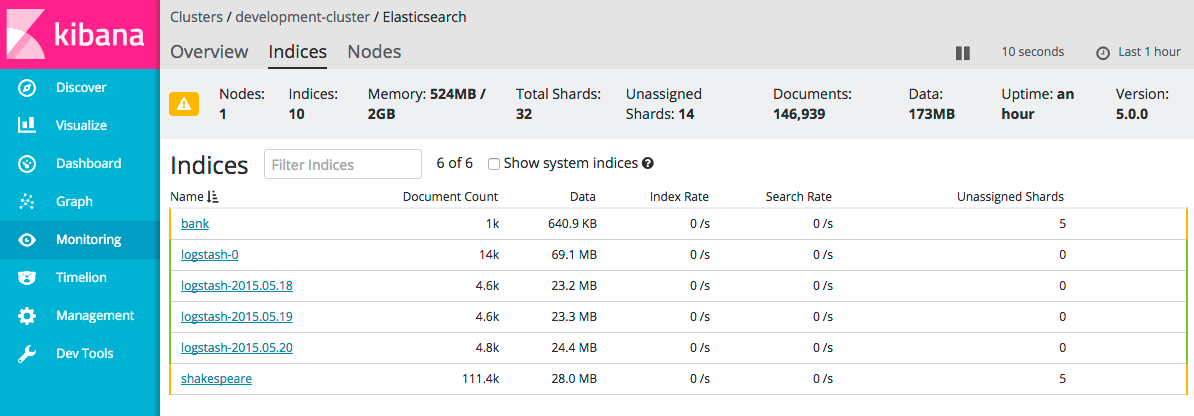
editTo view index metrics, click Indices. The Indices section shows the same overall index and search metrics as the Overview and a table of your indices.
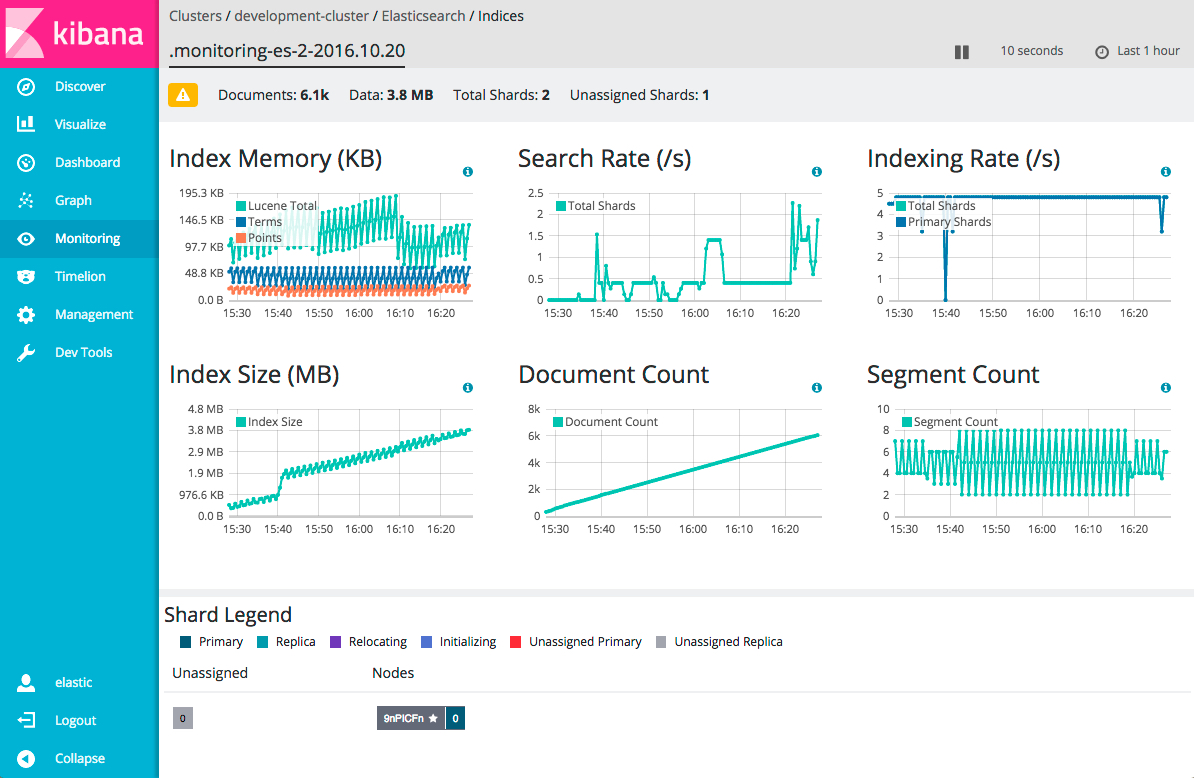
From there, you can view data for a particular index or group of indices. To drill down into the data for a particular index, click its name in the Indices table.
Nodes
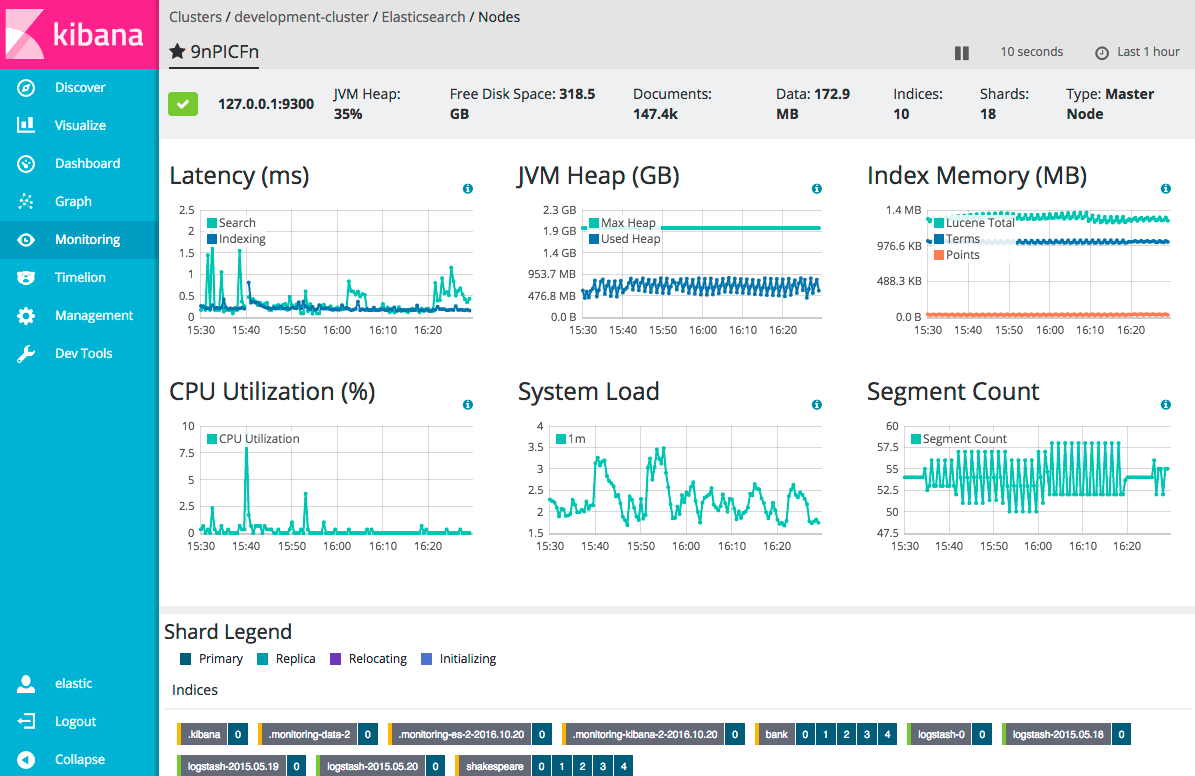
editTo view node metrics, click Nodes. The Nodes section shows the status of each node in your cluster.
Click the name of a node to view its node stats over time.
Kibana
editTo view the key metrics that indicate the overall health of Kibana itself, click Overview in the Kibana section.
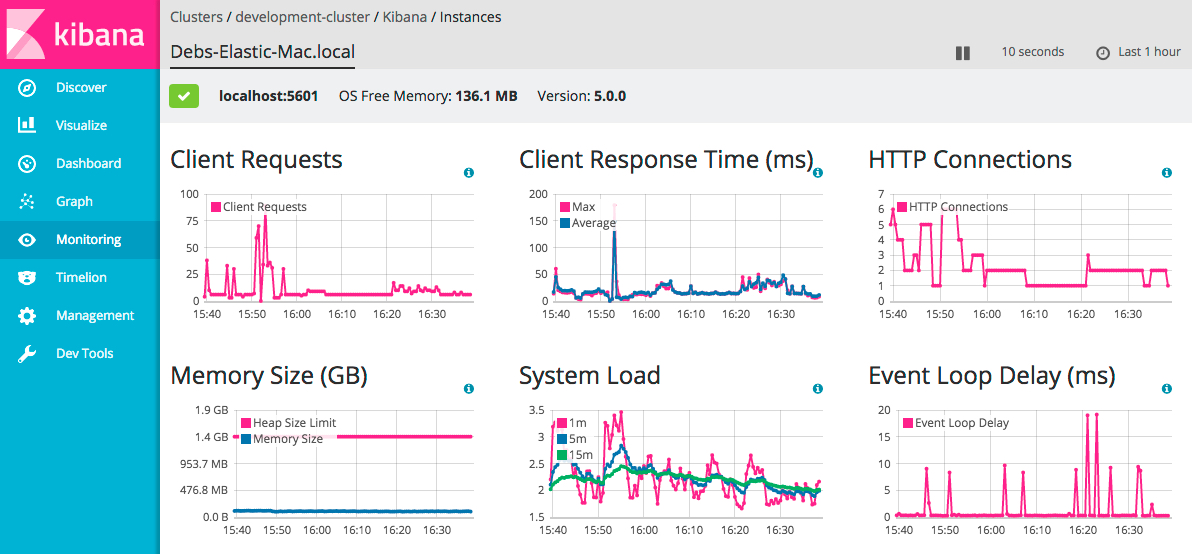
To view Kibana instance metrics, click Instances. The Instances section shows the status of each Kibana instance.
Click the name of an instance to view its instance stats over time.

