Elastic Security UI
editElastic Security UI
editThe Elastic Security app is a highly interactive workspace designed for security analysts that provides a clear overview of events and alerts from your environment. You can use the interactive UI to drill down into areas of interest.
Search
editFilter for alerts, events, processes, and other important security data by entering Kibana Query Language (KQL) queries in the search bar, which appears at the top of each page throughout the app. A date/time filter set to Today is enabled by default, but can be changed to any time range.

-
To refine your search results, select Add Filter (
 ), then enter the field, operator (such as
 is notoris between), and value for your filter. -
To save the current KQL query and any applied filters, select Saved query menu (
 ), enter a name for the saved query, and select Save saved query.
Navigation menu
editThe navigation menu contains direct links and expandable groups, identified by the group icon (![]() ).
).
- Click a top-level link to go directly to its landing page, which contains links and information for related pages.
-
Click a group’s icon (
 ) to open its flyout menu, which displays links to related pages within that group. Click a link in the flyout to navigate to its landing page.
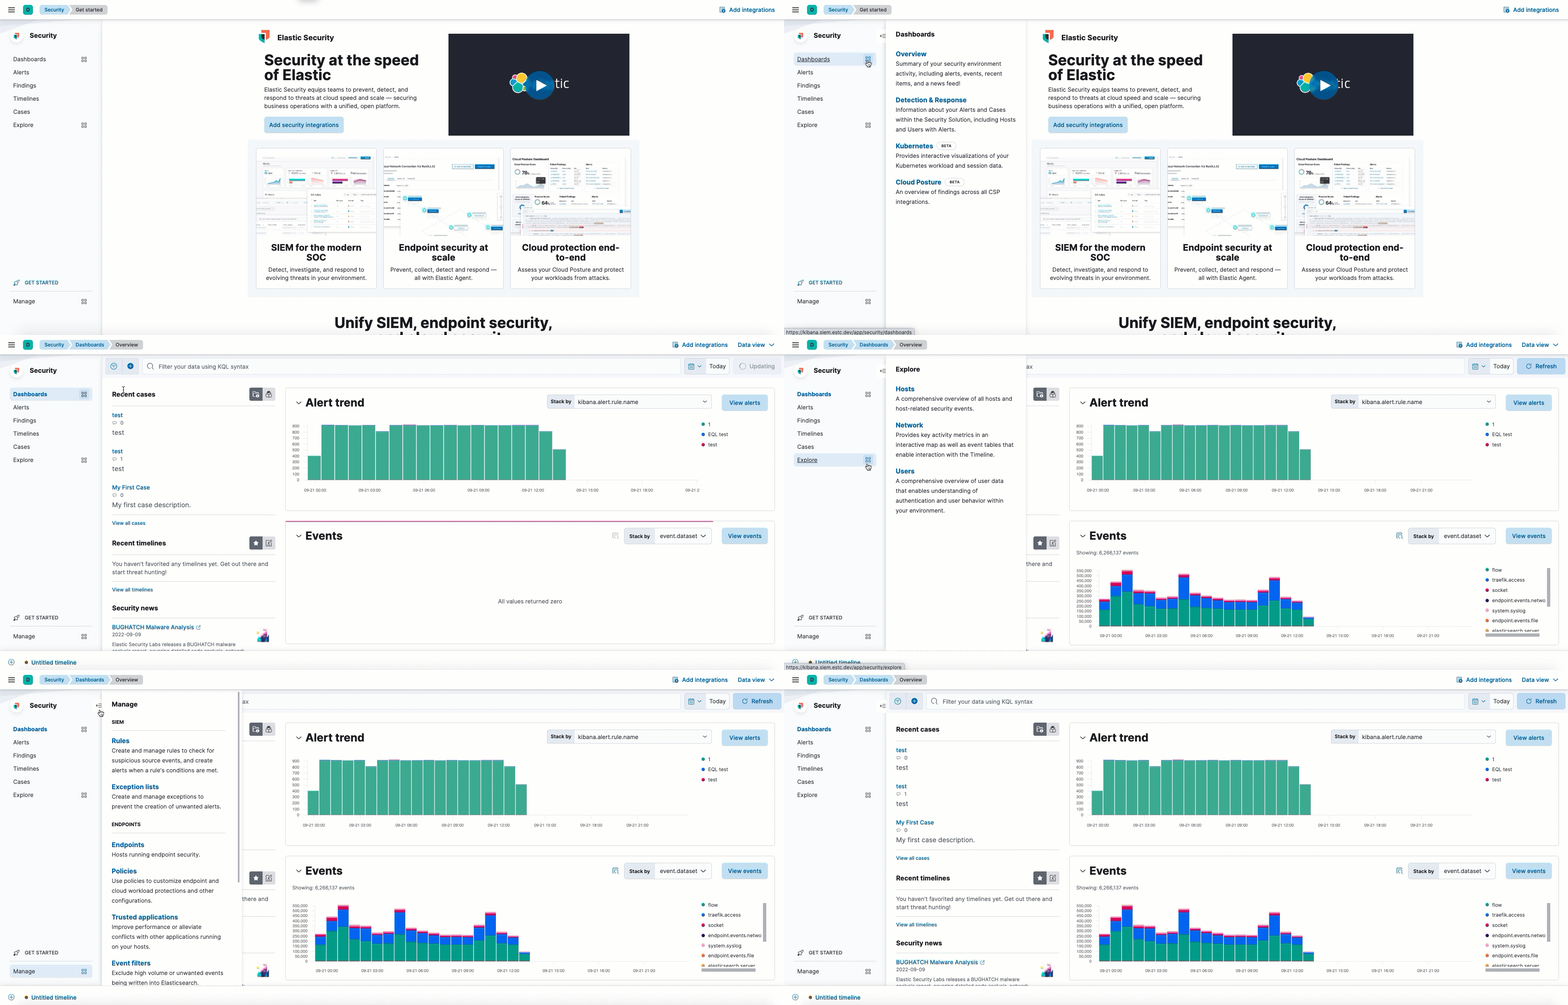
Click the Collapse side navigation icon (![]() ) to collapse and expand the main navigation menu.
) to collapse and expand the main navigation menu.
Elastic Security app pages
editThe Elastic Security app contains the following pages that enable analysts to view, analyze, and manage security data.
Dashboards
editExpand this section to access the Overview, Detection & Response, Kubernetes, and Cloud Posture dashboards, which provide interactive visualizations that summarize specific data within your environment. Refer to Dashboards for more information.

Alerts
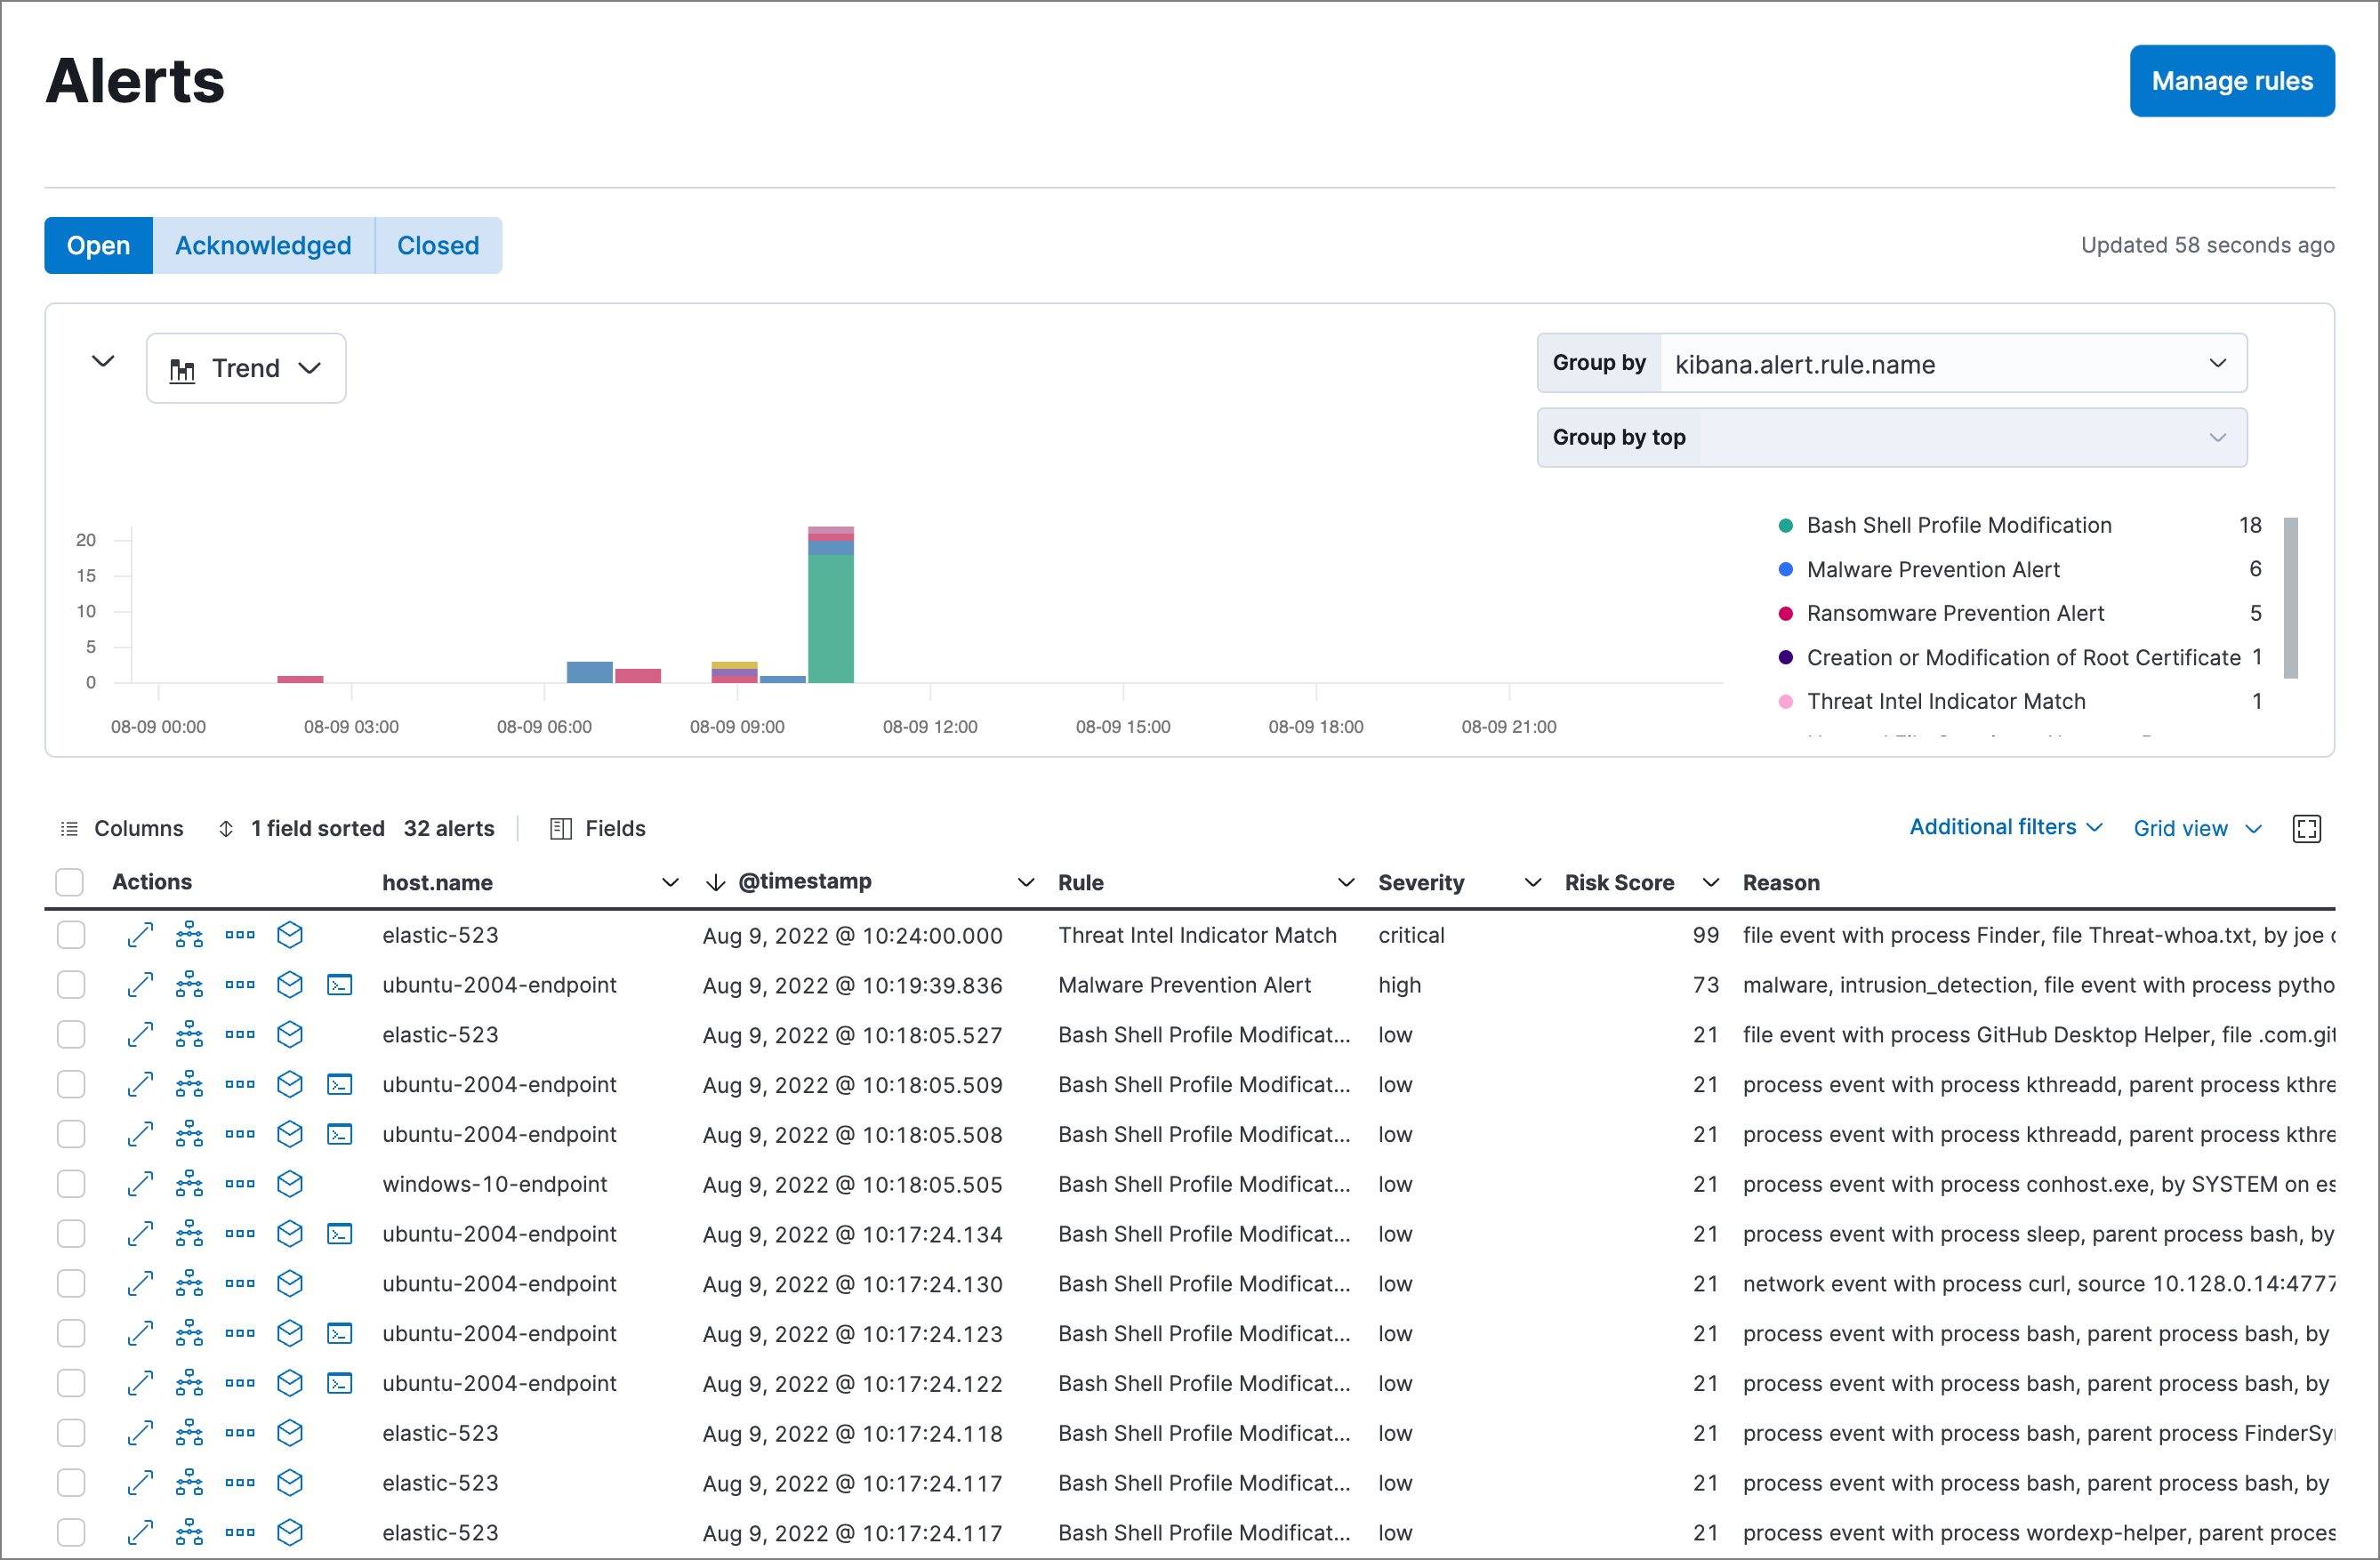
editView and manage alerts to monitor activity within your network. Refer to Detections and alerts for more information.
Findings
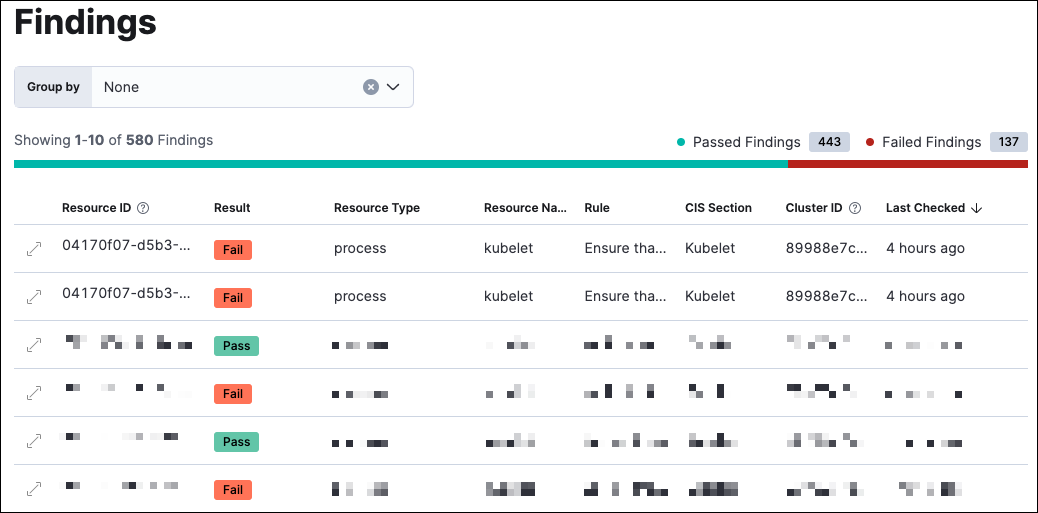
editCompare your Kubernetes infrastucture against a variety of security benchmarks. Refer to the Findings page to find out how to set this up.
Timelines
editInvestigate alerts and complex threats — such as lateral movement — in your network. Timelines are interactive and allow you to share your findings with other team members. Refer to Investigate events in Timeline to learn more.
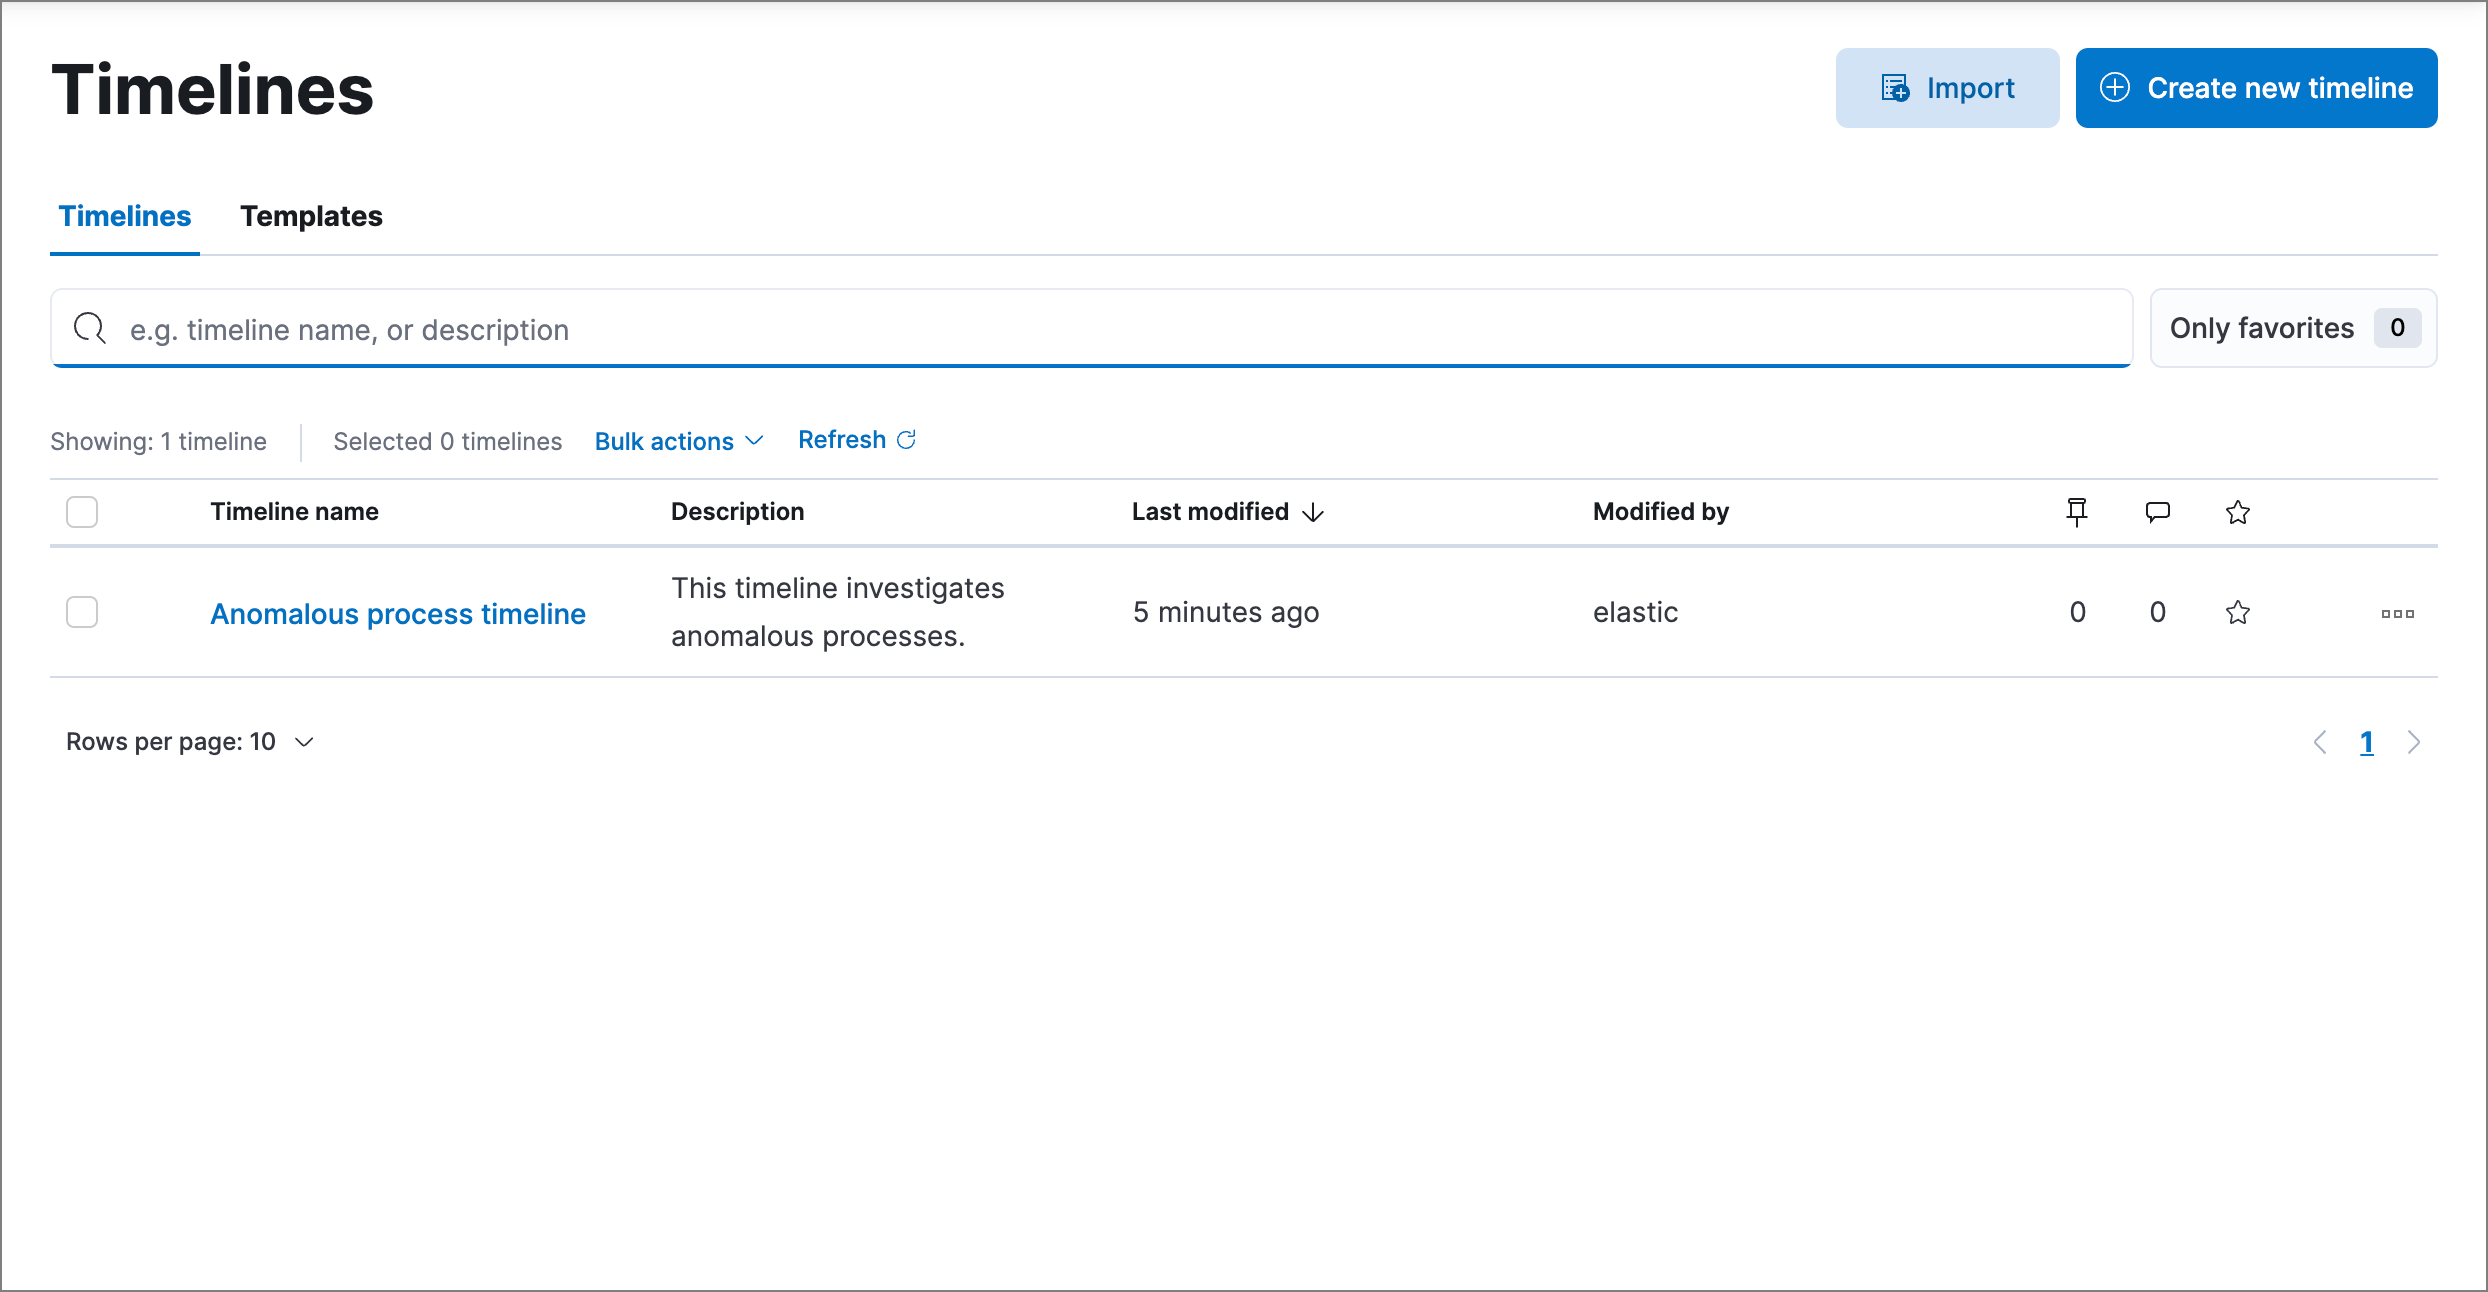
Select the collapsable Timeline button at the bottom of the Elastic Security app to start an investigation.
Cases
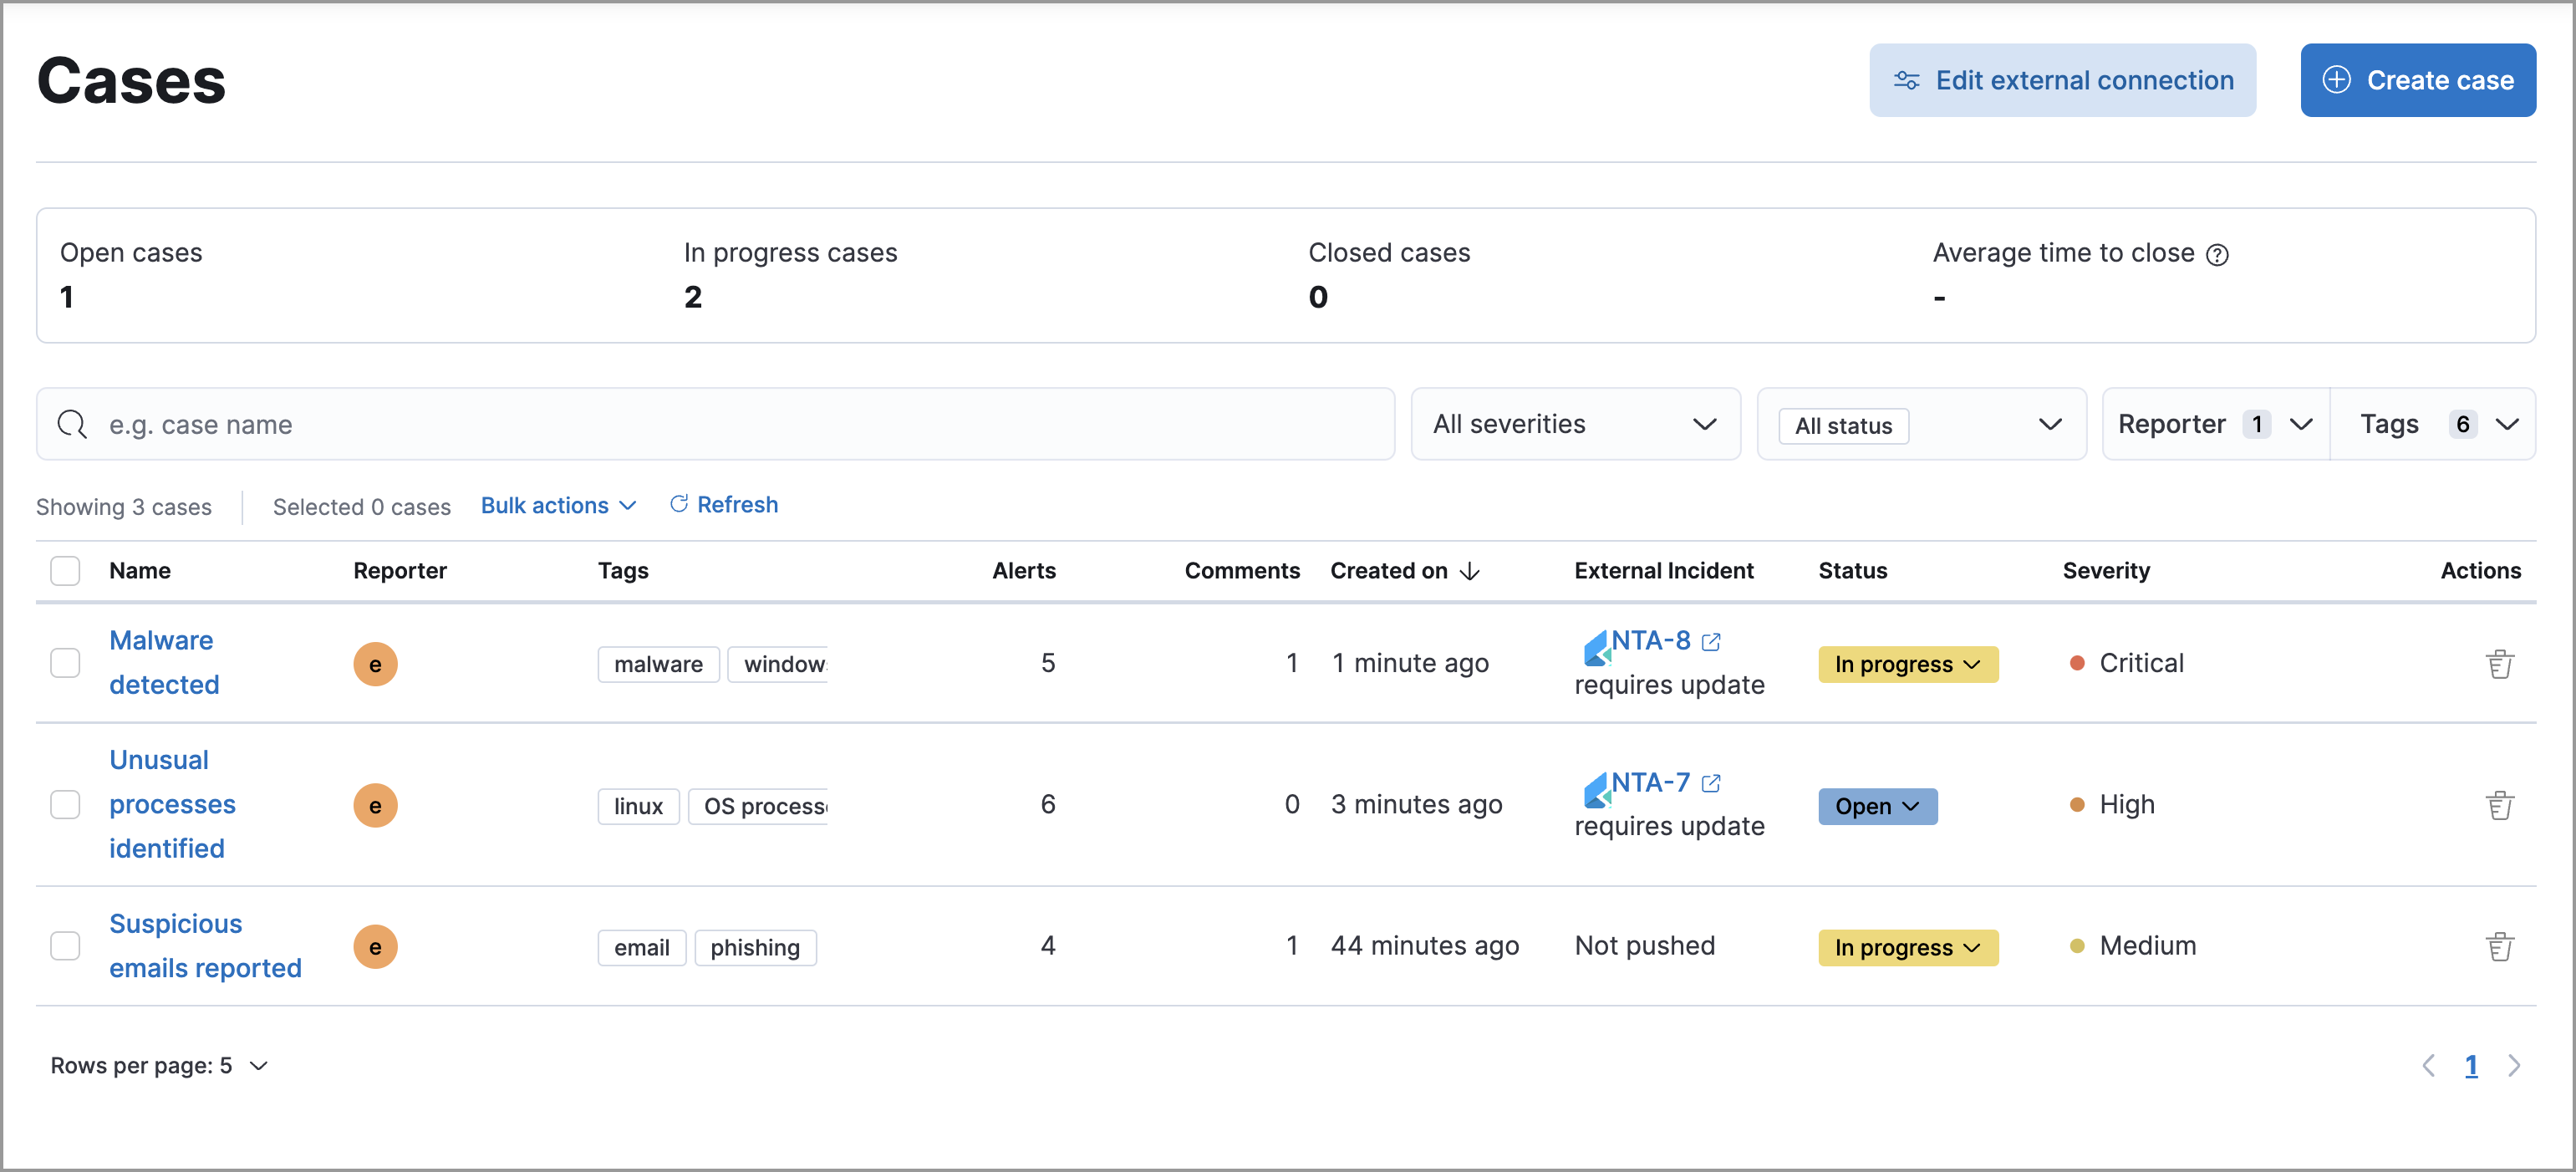
editOpen and track security issues. Refer to Cases to learn more.
Explore
editExpand this section to view the following pages:
-
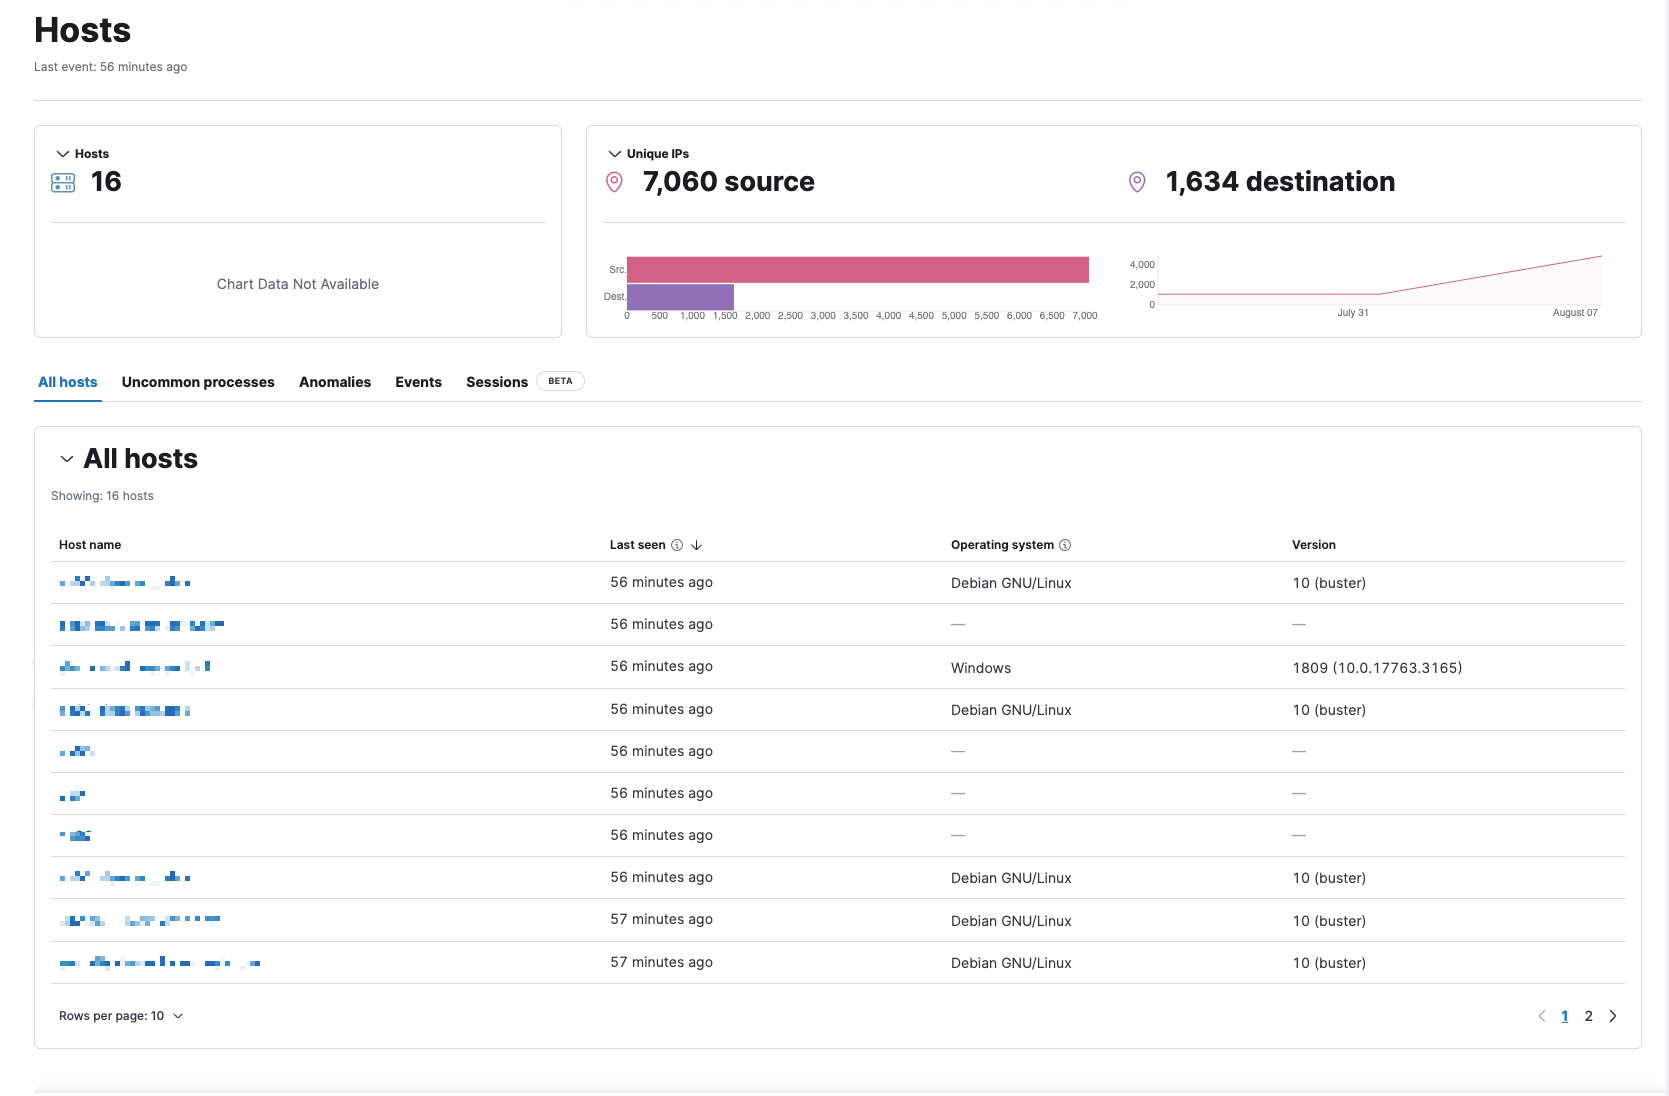
Hosts: Examine key metrics for host-related security events using graphs, charts, and interactive data tables.
-
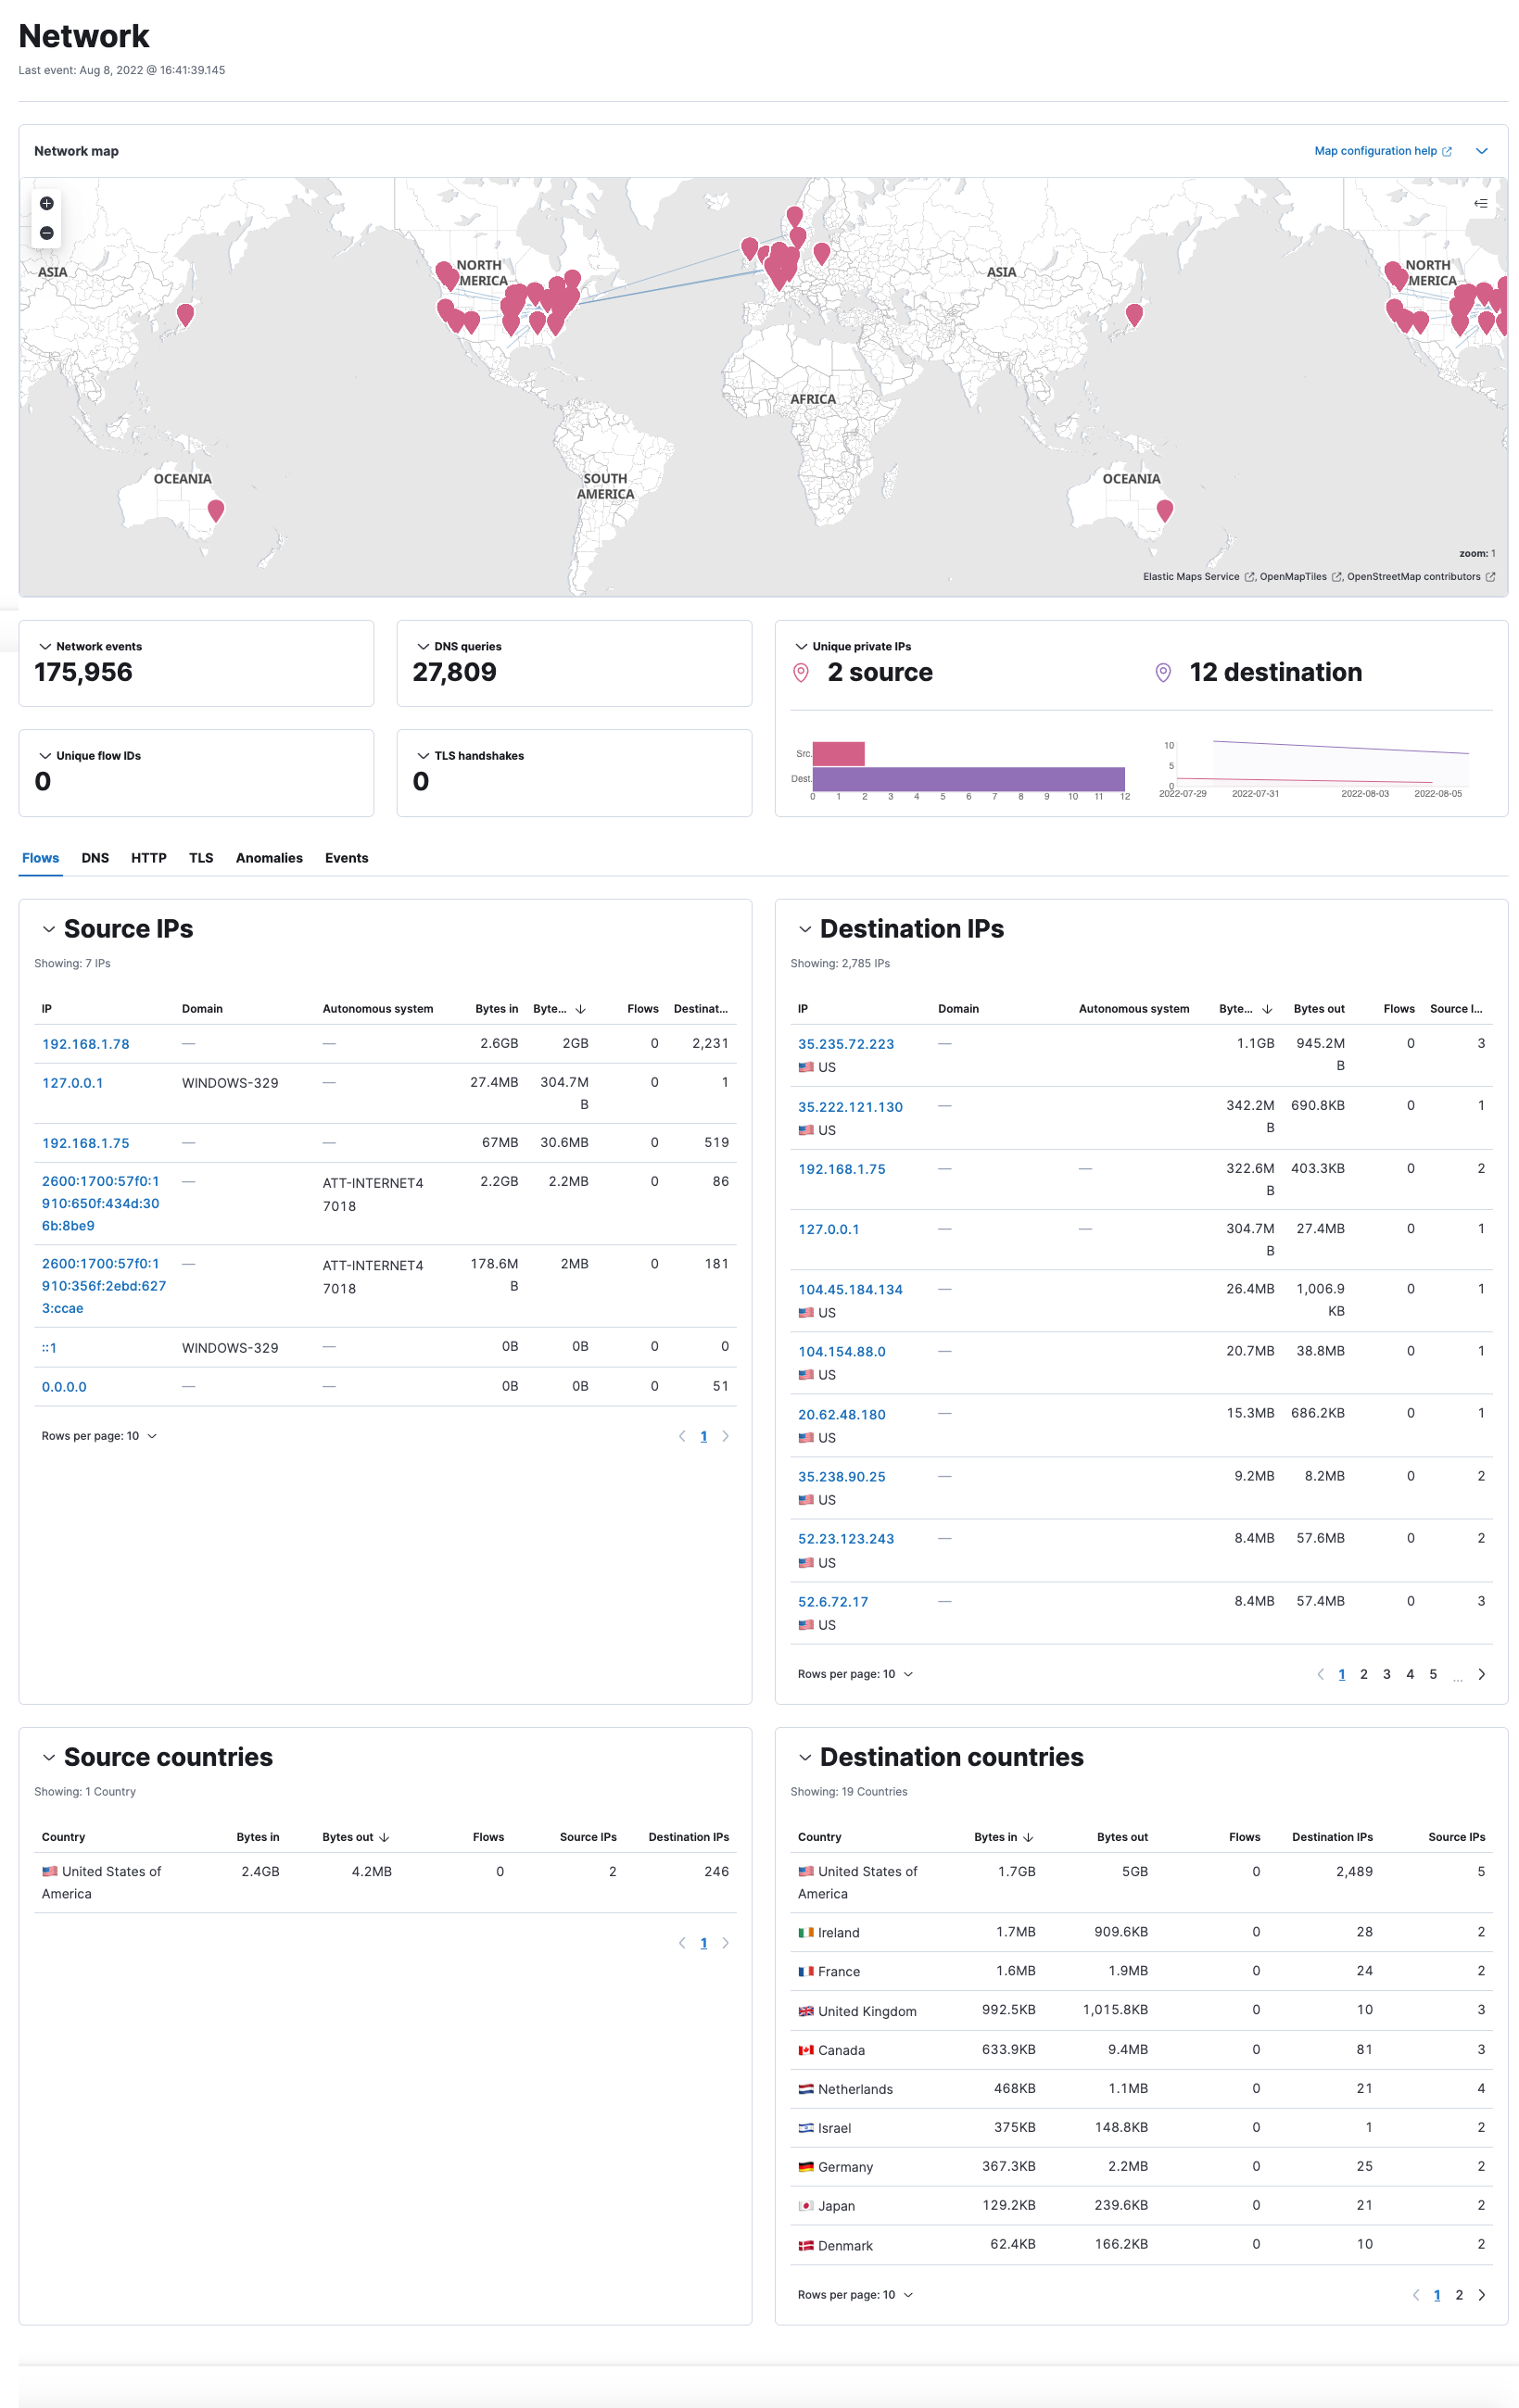
Network: Explore the interactive map to discover key network activity metrics and investigate network events further in Timeline.
-
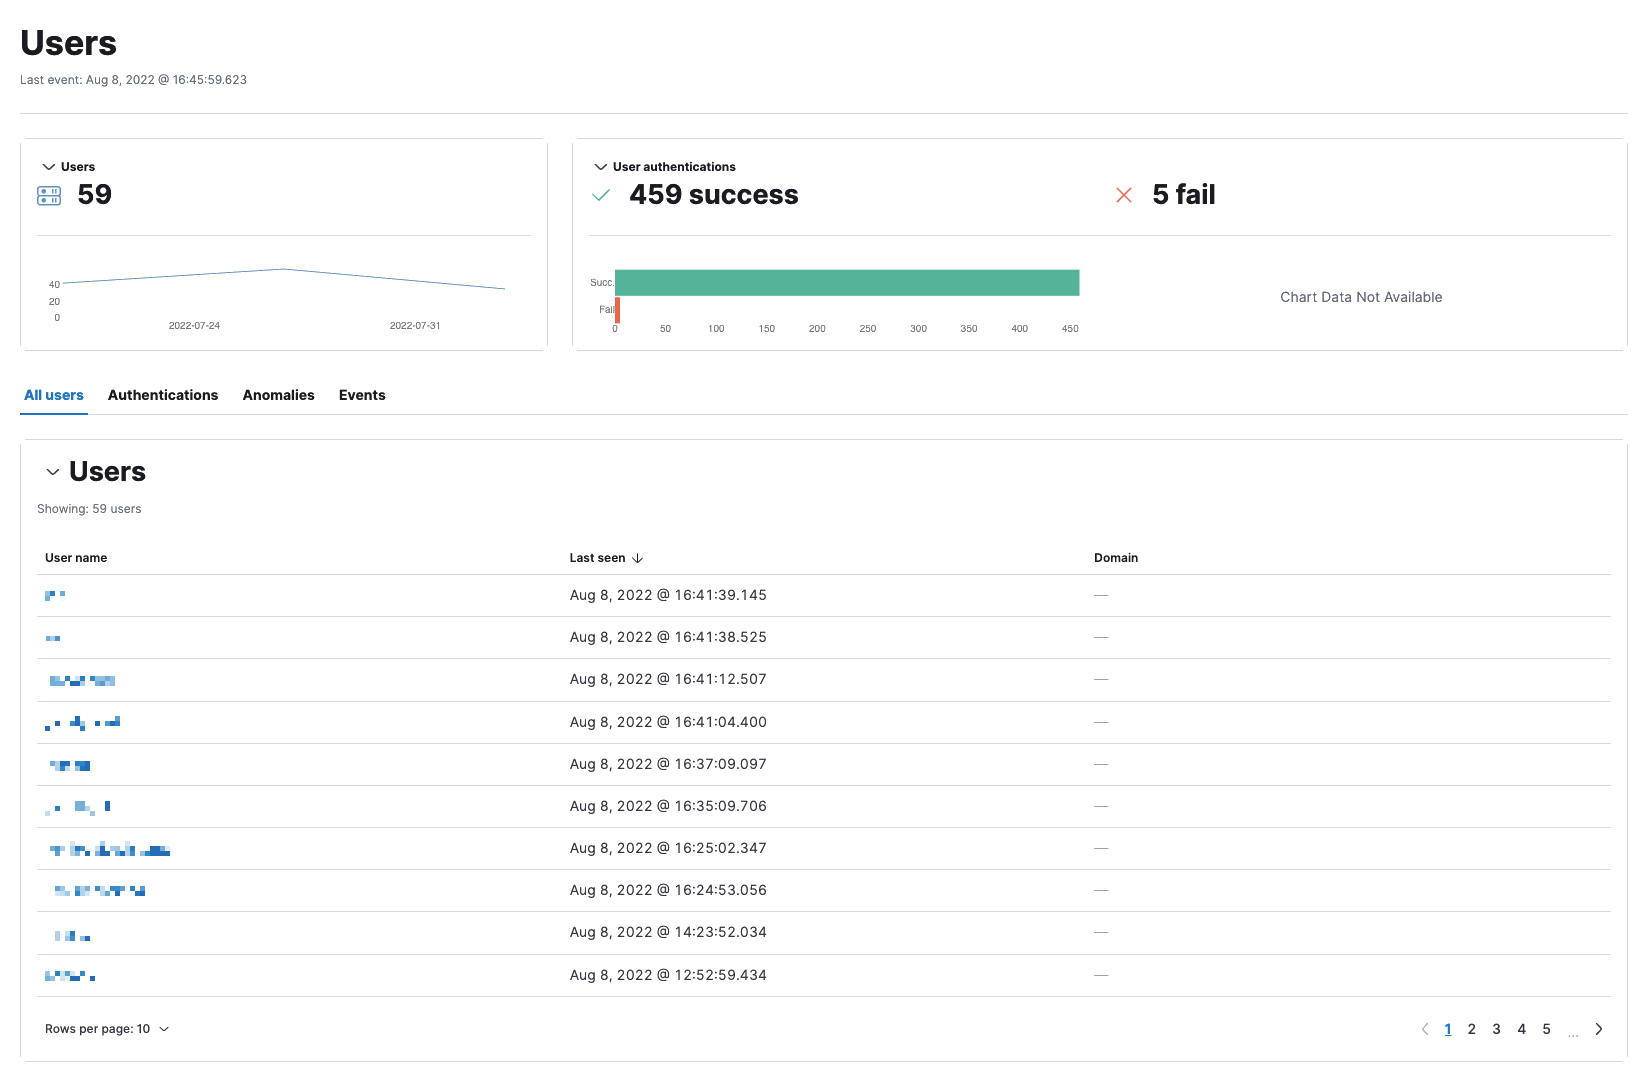
Users: Access a comprehensive overview of user data to help you understand authentication and user behavior within your environment.
Get started
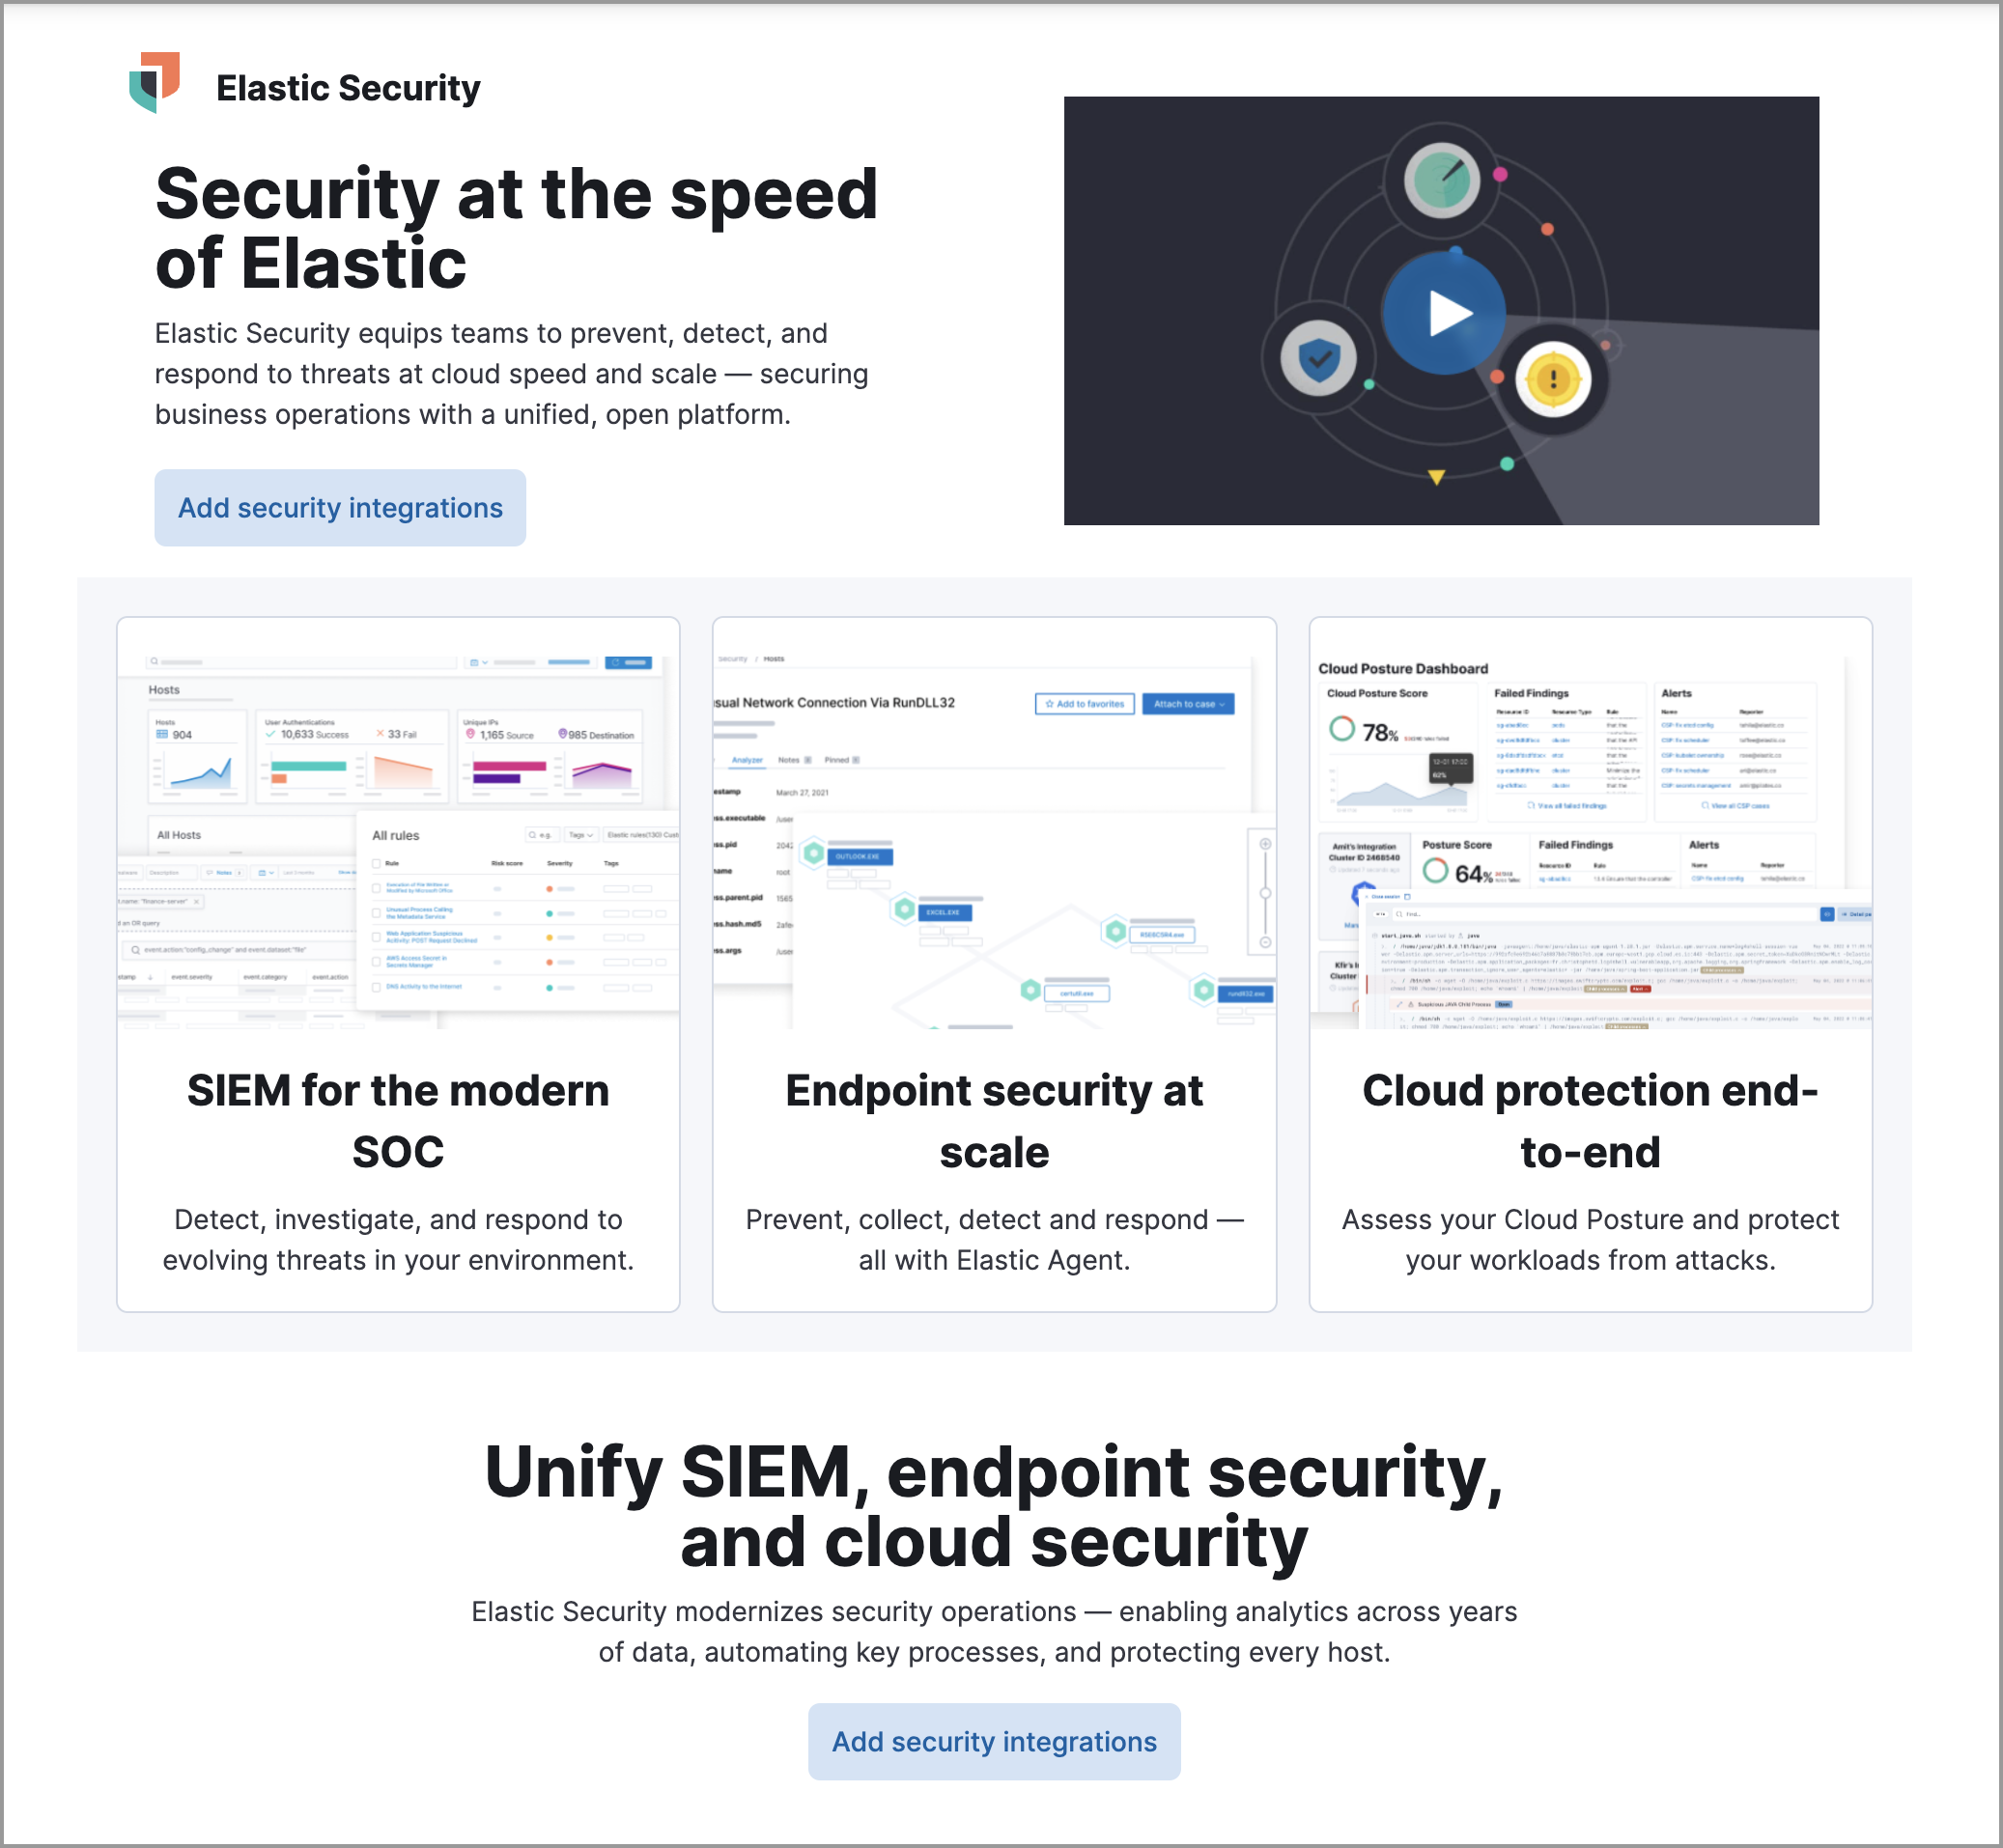
editQuickly add security integrations that can ingest data and monitor your hosts.
Manage
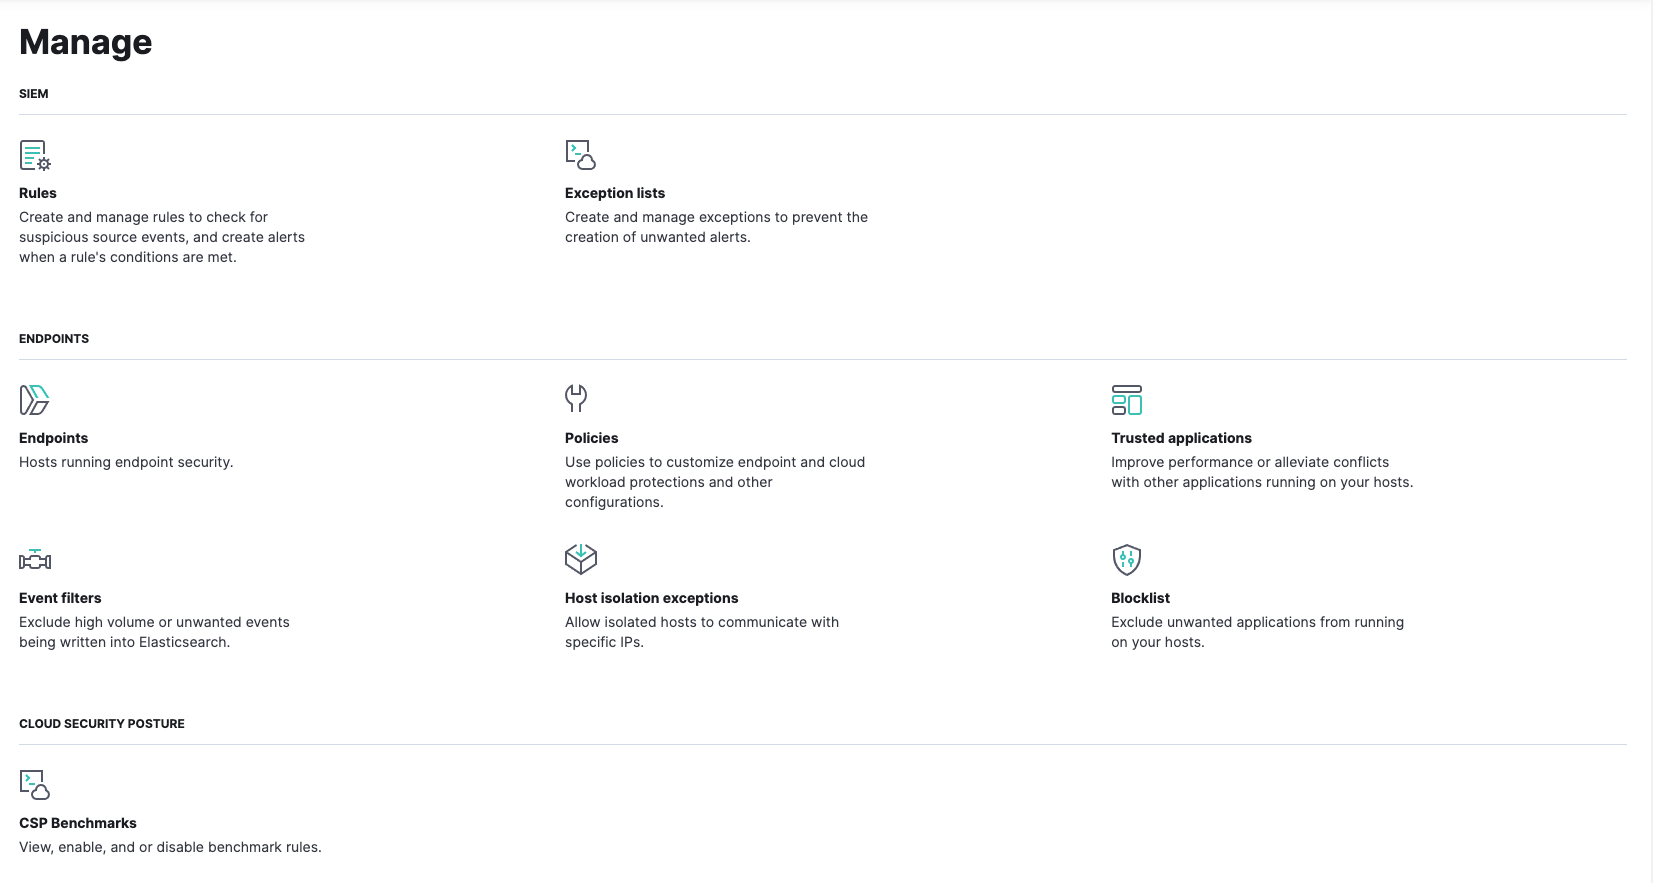
editExpand this section to access and manage additional security features:
- Rules: Create and manage rules to monitor suspicious events.
- Exception lists: View and manage all rule exceptions.
- Endpoints: View and manage hosts running Endpoint and Cloud Security.
- Policies: View and manage Endpoint and Cloud Security integration policies.
- Trusted applications: View and manage trusted Windows, macOS, and Linux applications.
- Event filters: View and manage event filters, which allow you to filter endpoint events you don’t need to want stored in Elasticsearch.
- Host isolation exceptions: View and manage host isolation exceptions, which specify IP addresses that can communicate with your hosts even when those hosts are blocked from your network.
- Blocklist: View and manage the blocklist, which allows you to prevent specified applications from running on hosts, extending the list of processes that Endpoint and Cloud Security considers malicious.
- CSP Benchmarks: View, enable, or disable benchmark rules.
Accessibility features
editAccessibility features, such as keyboard focus and screen reader support, are built into the Elastic Security UI. These features offer additional ways to navigate the UI and interact with the application.
Interact with draggable elements
editUse your keyboard to interact with draggable elements in the Elastic Security UI:
-
Press the
Tabkey to apply keyboard focus to an element within a table. Or, use your mouse to click on an element and apply keyboard focus to it.

-
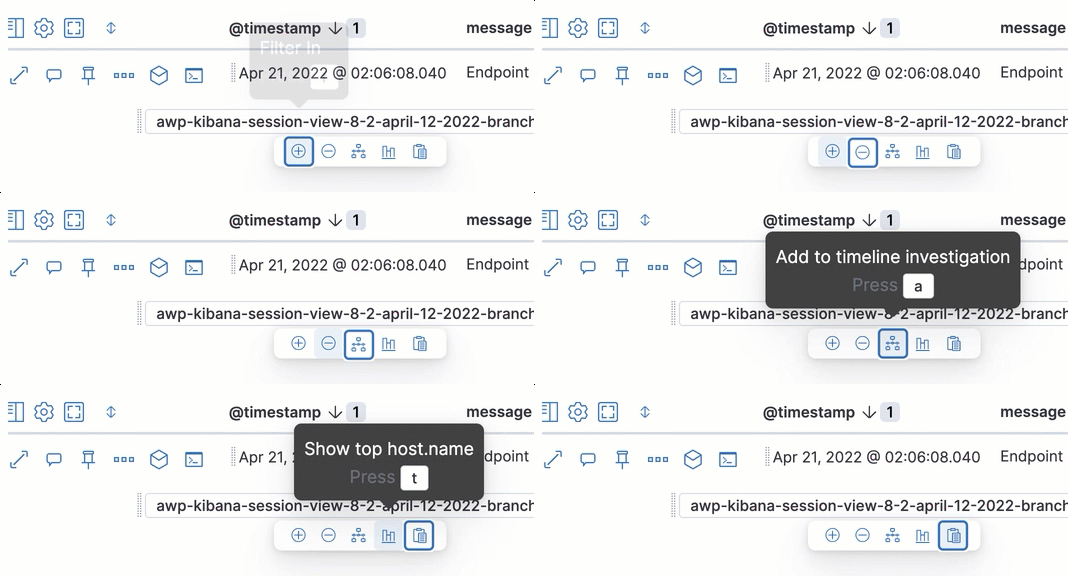
Press
Enteron an element with keyboard focus to display its menu and pressTabto apply focus sequentially to menu options. Thef,o,a,t,chotkeys are automatically enabled during this process and offer an alternative way to interact with menu options.
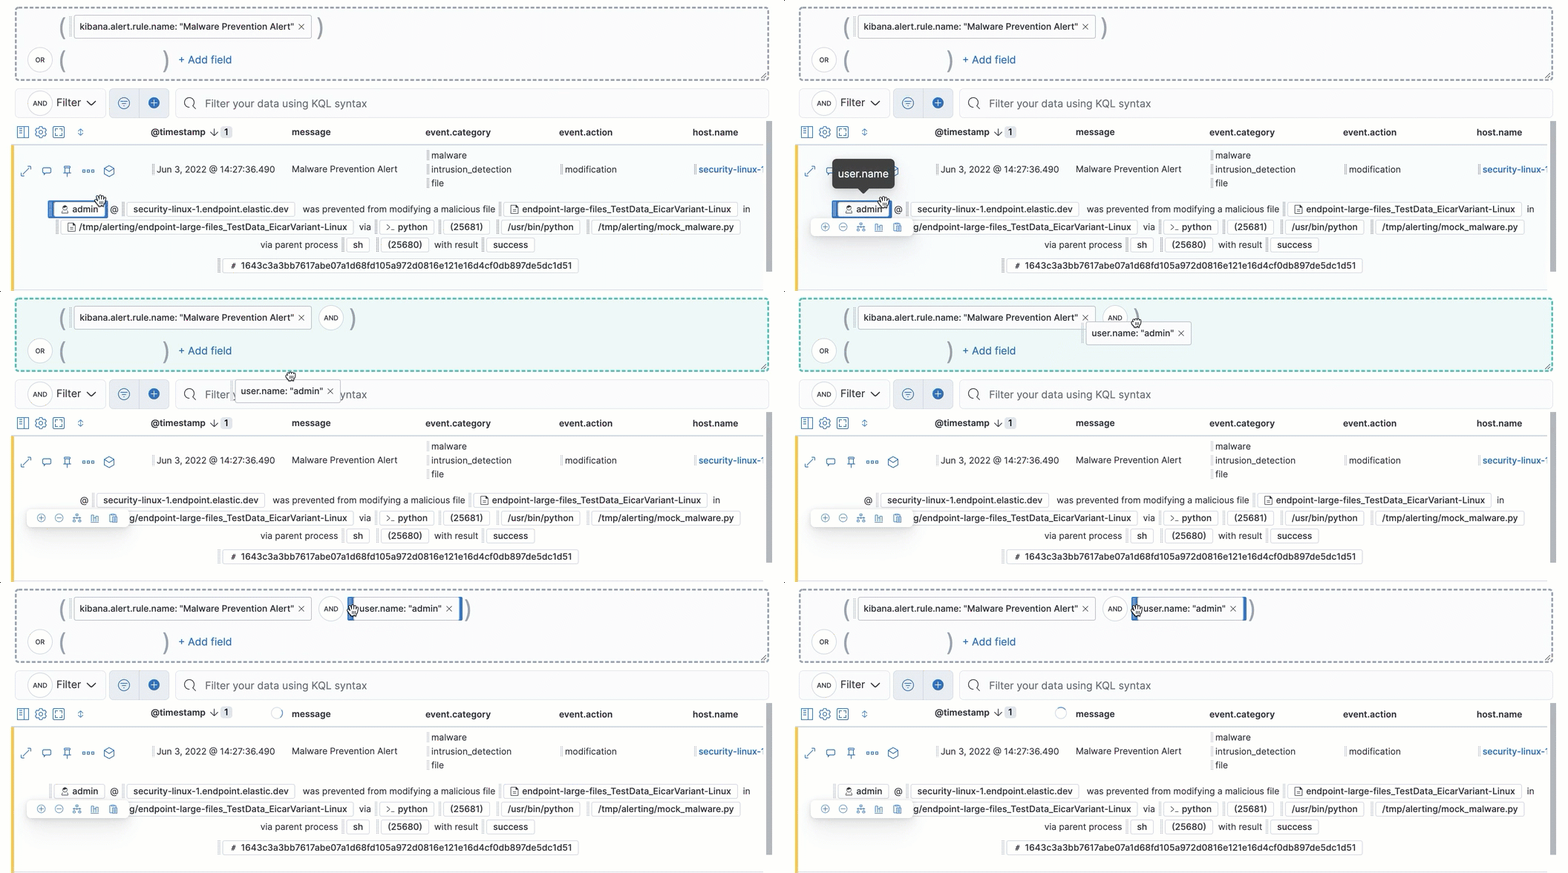
- Press the spacebar once to begin dragging an element to a different location and press it a second time to drop it. Use the directional arrows to move the element around the UI.
-
If an event has an event renderer, press the
Shiftkey and the down directional arrow to apply keyboard focus to the event renderer andTaborShift+Tabto navigate between fields. To return to the cells in the current row, press the up directional arrow. To move to the next row, press the down directional arrow.

Navigate the Elastic Security UI
editUse your keyboard to navigate through rows, columns, and menu options in the Elastic Security UI:
- Use the directional arrows to move keyboard focus right, left, up, and down in a table.

-
Press the
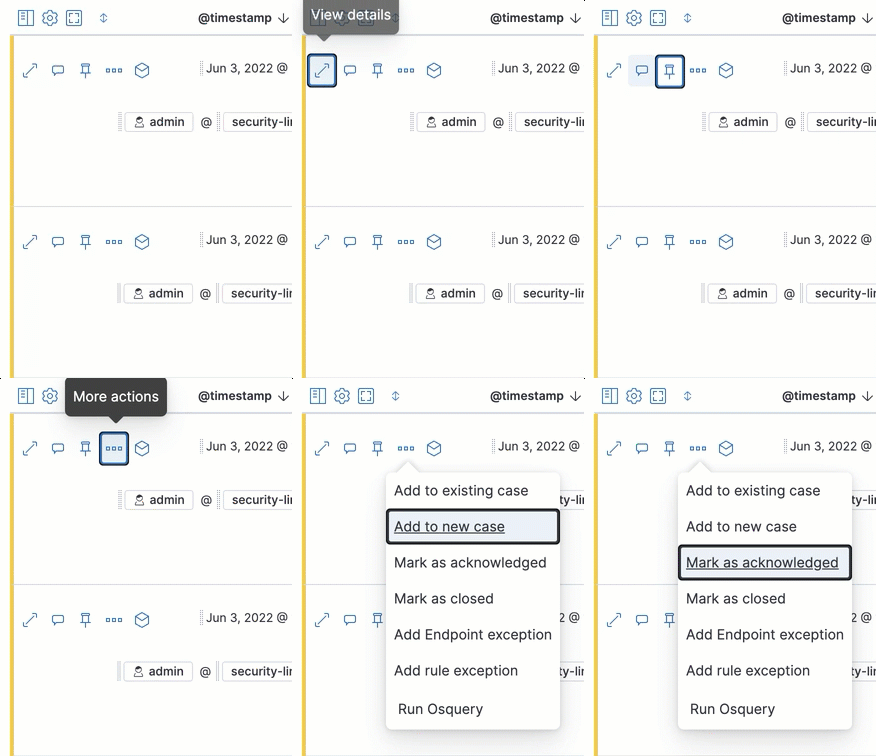
Tabkey to navigate through a table cell with multiple elements, such as buttons, field names, and menus. Pressing theTabkey will sequentially apply keyboard focus to each element in the table cell.
-
Use
CTRL + Hometo shift keyboard focus to the first cell in a row. Likewise, useCTRL + Endto move keyboard focus to the last cell in the row.

-
Use the
Page UpandPage Downkeys to scroll through the page.
