- Observability: other versions:
- What is Elastic Observability?
- What’s new in 8.6
- Send data to Elasticsearch
- Spin up the Elastic Stack
- Deploy Elastic Agent to send data
- Deploy Beats to send data
- Elastic Serverless Forwarder for AWS
- Deploy serverless forwarder
- Configuration options
- Troubleshooting
- Observability overview page
- Application performance monitoring (APM)
- Application logs
- Log monitoring
- Infrastructure monitoring
- Uptime and synthetic monitoring
- User Experience
- Alerting
- Cases
- CI/CD observability
- Troubleshooting
- Fields reference
- Tutorials
- Monitor Amazon Web Services (AWS) with Elastic Agent
- Monitor Amazon Web Services (AWS) with Beats
- Monitor Google Cloud Platform
- Monitor a Java application
- Monitor Kubernetes
- Monitor Microsoft Azure with Elastic Agent
- Monitor Microsoft Azure with the native Azure integration
- Monitor Microsoft Azure with Beats
IMPORTANT: No additional bug fixes or documentation updates
will be released for this version. For the latest information, see the
current release documentation.
Application performance monitoring (APM)
editApplication performance monitoring (APM)
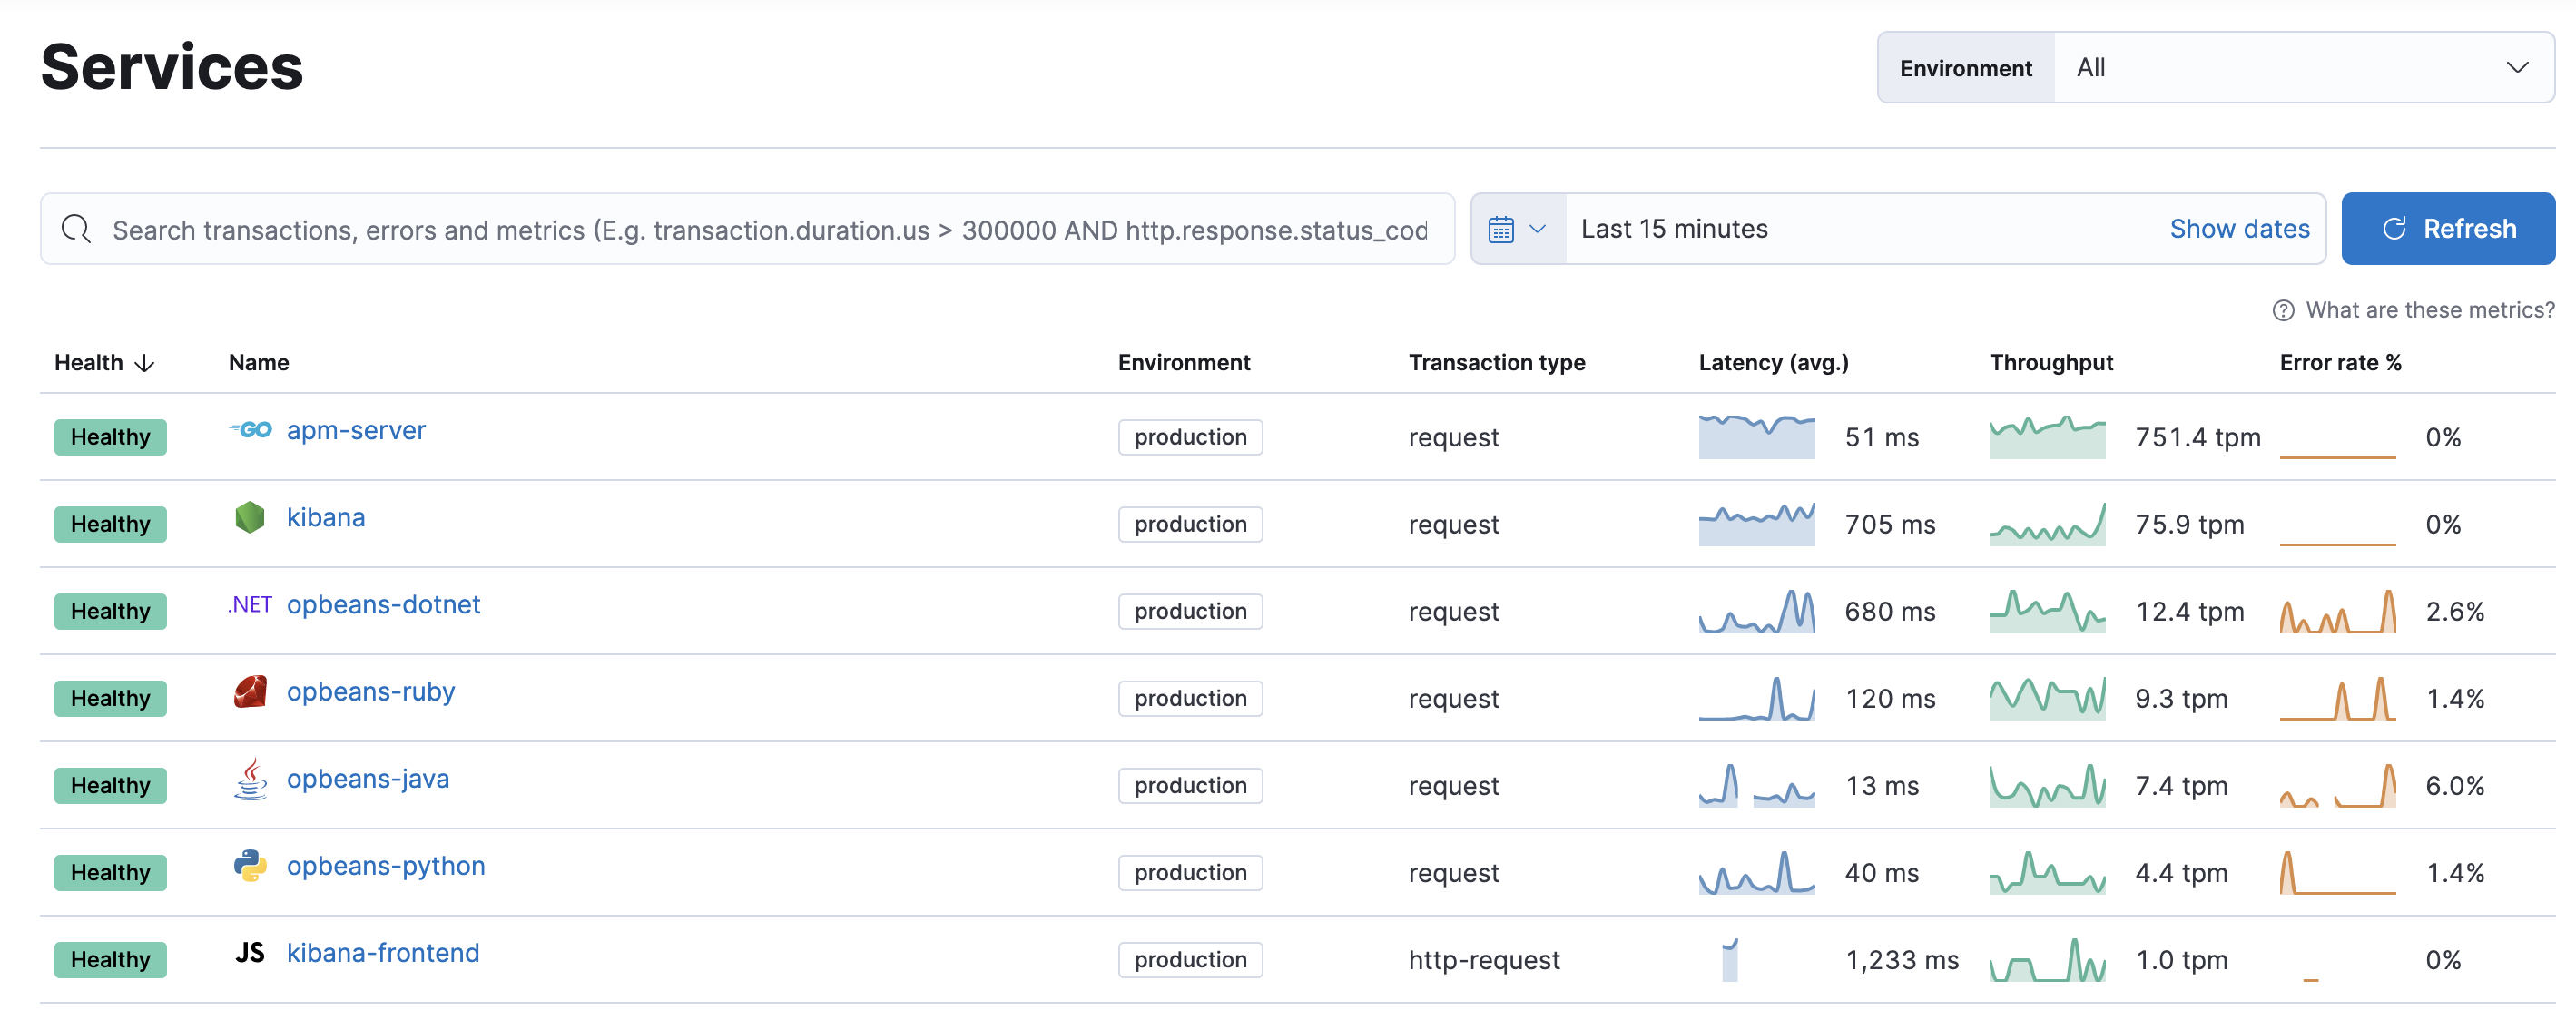
editElastic APM is an application performance monitoring system built on the Elastic Stack. It allows you to monitor software services and applications in real time, by collecting detailed performance information on response time for incoming requests, database queries, calls to caches, external HTTP requests, and more.

To learn more, see APM Overview.
Was this helpful?
Thank you for your feedback.