Storage Explorer
editStorage Explorer
editAnalyze your APM data and manage costs with storage explorer. For example, analyze the storage footprint of each of your services to see which are producing large amounts of data—then change the sample rate of a service to lower the amount of data ingested. Or, expand the time filter to visualize data trends over time so that you can better forecast and prepare for future storage needs.
Index lifecycle phases
editA default index lifecycle policy is applied to each APM data stream, but can be customized depending on your business needs. Use the Index lifecycle phase dropdown to visualize and analyze your storage by phase.
Customizing the default APM index lifecycle policies can save money by specifying things like:
- The point at which an index can be moved to less performant hardware.
- The point at which availability is not as critical and the number of replicas can be reduced.
- When the index can be safely deleted.
See Index lifecycle management to learn more about customizing the default APM index lifecycle policies.
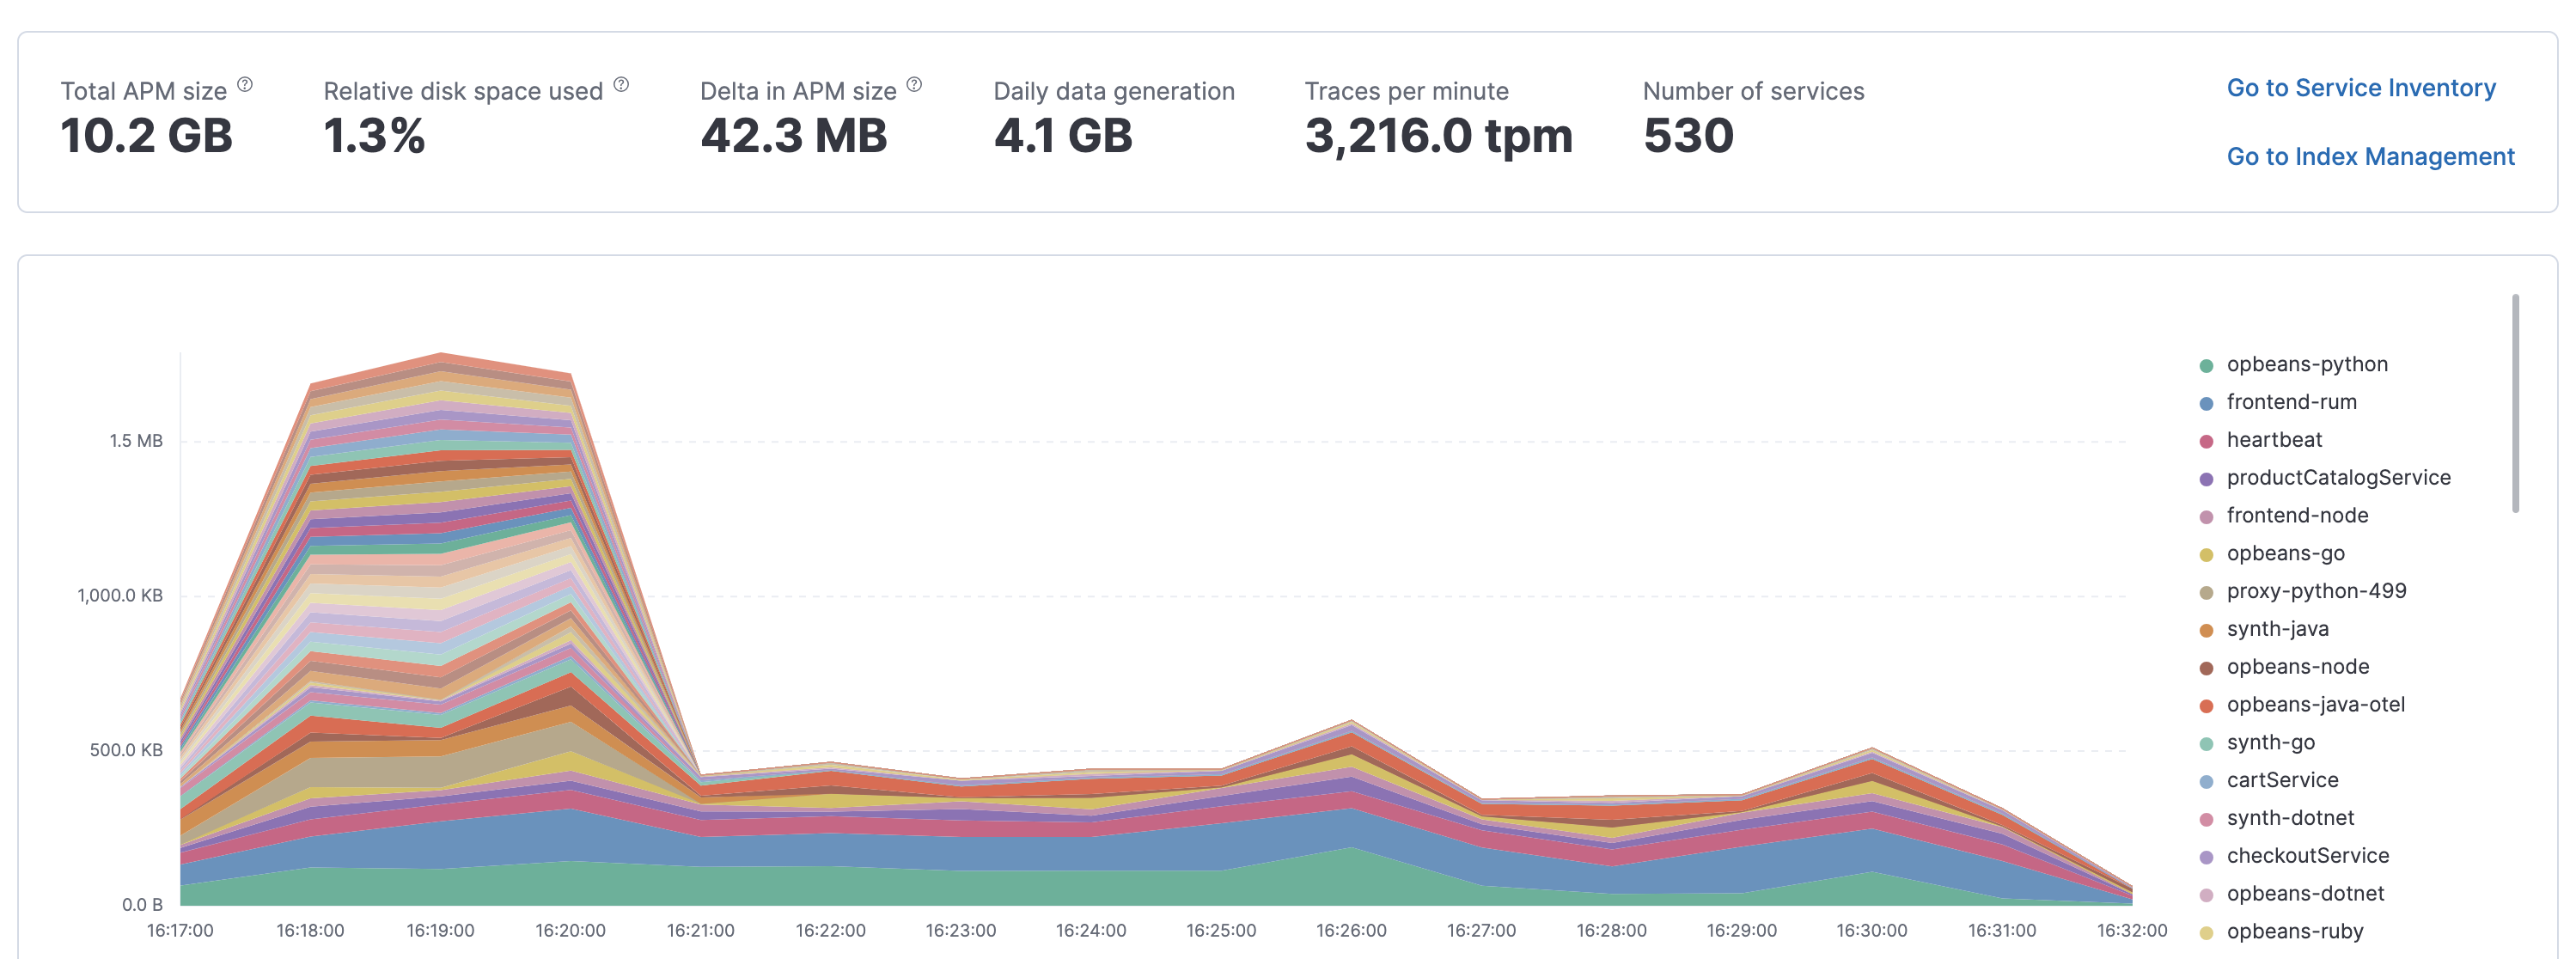
Service size chart
editThe service size chart displays the estimated size of each service over time. Expand the time filter to visualize data trends and estimate daily data generation.
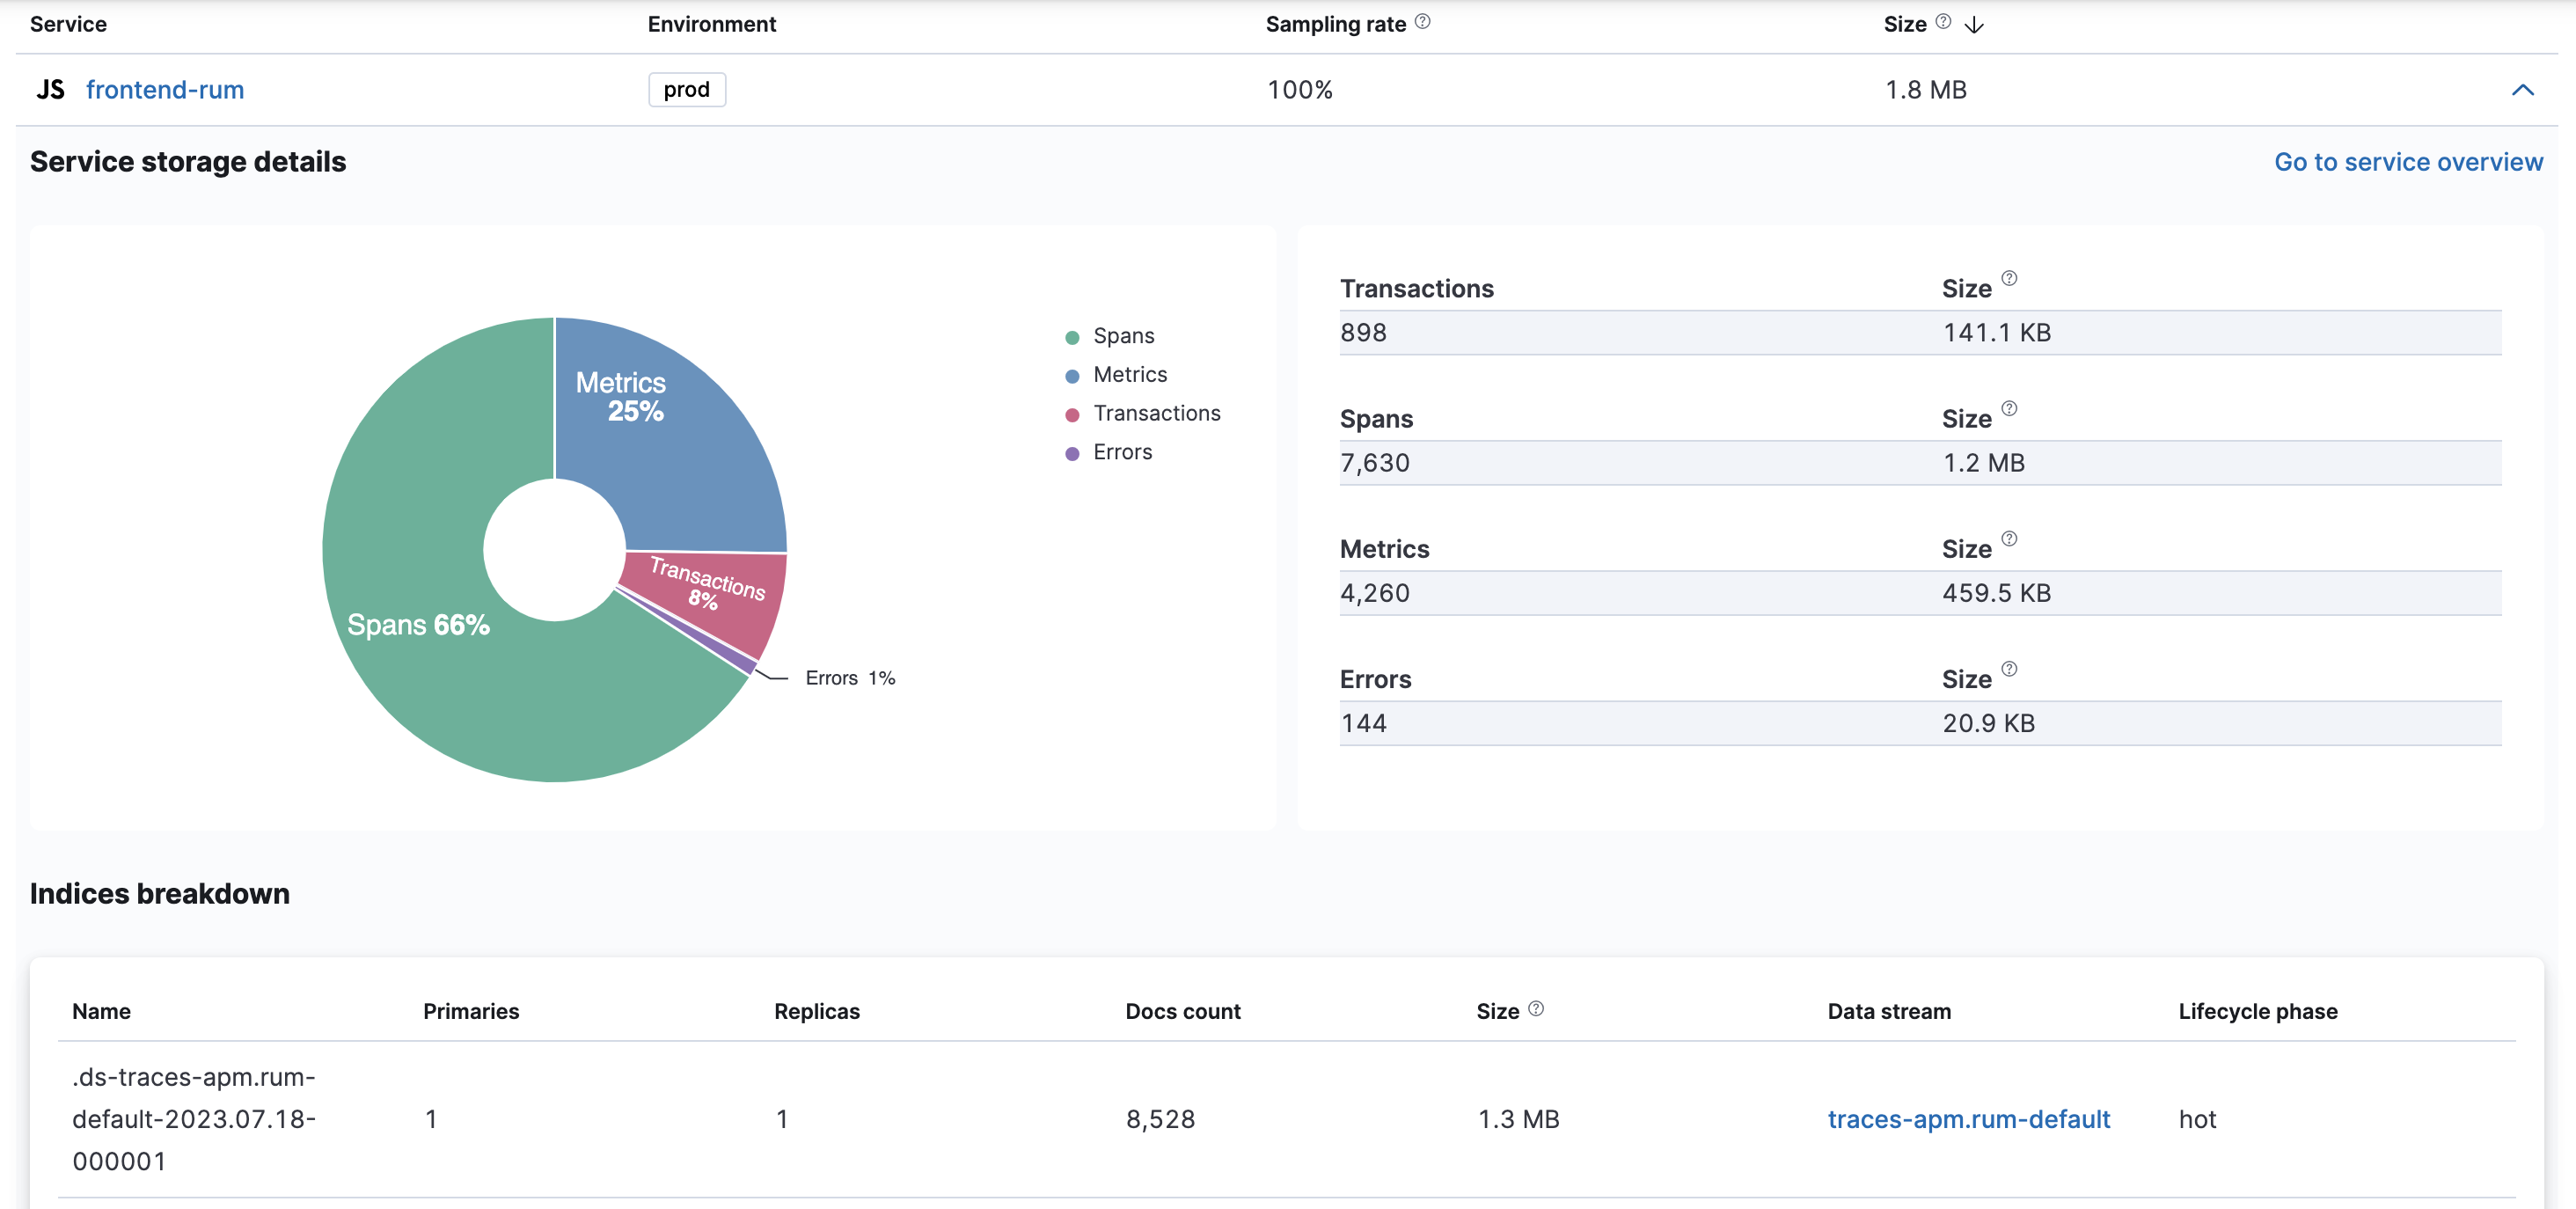
Service statistics table
editThe service statistics table provides detailed information on each service:
- A list of service environments.
- The sampling rate. This value is calculated by dividing the number of sampled transactions by total throughput. It might differ from the configured sampling rate for two reasons: with head-based sampling, the initial service makes the sampling decision, and with tail-based sampling, granular policies allow you to set multiple sample rates.
- The estimated size on disk. This storage size includes both primary and replica shards and is calculated by prorating the total size of your indices by the service’s document count divided by the total number of documents.
- Number of transactions, spans, errors, and metrics — doc count and size on disk.
As you explore your service statistics, you might want to take action to reduce the number of documents and therefore storage size of a particular service.
To reduce the number of transactions a service generates, configure a more aggressive transaction sampling policy. Transaction sampling lowers the amount of data ingested without negatively impacting the usefulness of your data.
To reduce the number of spans a service generates, enable span compression. Span compression saves on data and transfer costs by compressing multiple, similar spans into a single span.
To reduce the number of system, runtime, and application metrics, tune the APM agent or agents that are collecting the data. You can disable the collection of specific metrics with the disable metrics configuration. Or, you can set the metrics interval to zero seconds to deactivate metrics entirely. Most APM agents support both options. See the relevant APM agent configuration options for more details.
To reduce the number of errors a service generate, work with your developers to change how exceptions are handled in your code.
Privileges
editStorage Explorer requires expanded privileges to view. See Create a storage explorer user for more information.
Limitations
editMulti-cluster deployments are not supported.