- Observability: other versions:
- Get started
- What is Elastic Observability?
- What’s new in 8.16
- Quickstart: Monitor hosts with Elastic Agent
- Quickstart: Monitor your Kubernetes cluster with Elastic Agent
- Quickstart: Monitor hosts with OpenTelemetry
- Quickstart: Unified Kubernetes Observability with Elastic Distributions of OpenTelemetry (EDOT)
- Quickstart: Collect data with AWS Firehose
- Add data from Splunk
- Applications and services
- Application performance monitoring (APM)
- Get started
- Learn about data types
- Collect application data
- View and analyze data
- Act on data
- Use APM securely
- Manage storage
- Configure APM Server
- Monitor APM Server
- APM APIs
- Troubleshooting
- Upgrade
- Release notes
- Known issues
- Synthetic monitoring
- Get started
- Scripting browser monitors
- Configure lightweight monitors
- Manage monitors
- Work with params and secrets
- Analyze monitor data
- Monitor resources on private networks
- Use the CLI
- Configure projects
- Multi-factor Authentication
- Configure Synthetics settings
- Grant users access to secured resources
- Manage data retention
- Use Synthetics with traffic filters
- Migrate from the Elastic Synthetics integration
- Scale and architect a deployment
- Synthetics support matrix
- Synthetics Encryption and Security
- Troubleshooting
- Real user monitoring
- Uptime monitoring (deprecated)
- Tutorial: Monitor a Java application
- Application performance monitoring (APM)
- CI/CD
- Cloud
- Infrastructure and hosts
- Logs
- Troubleshooting
- Incident management
- Data set quality
- Observability AI Assistant
- Reference
Logs
editLogs
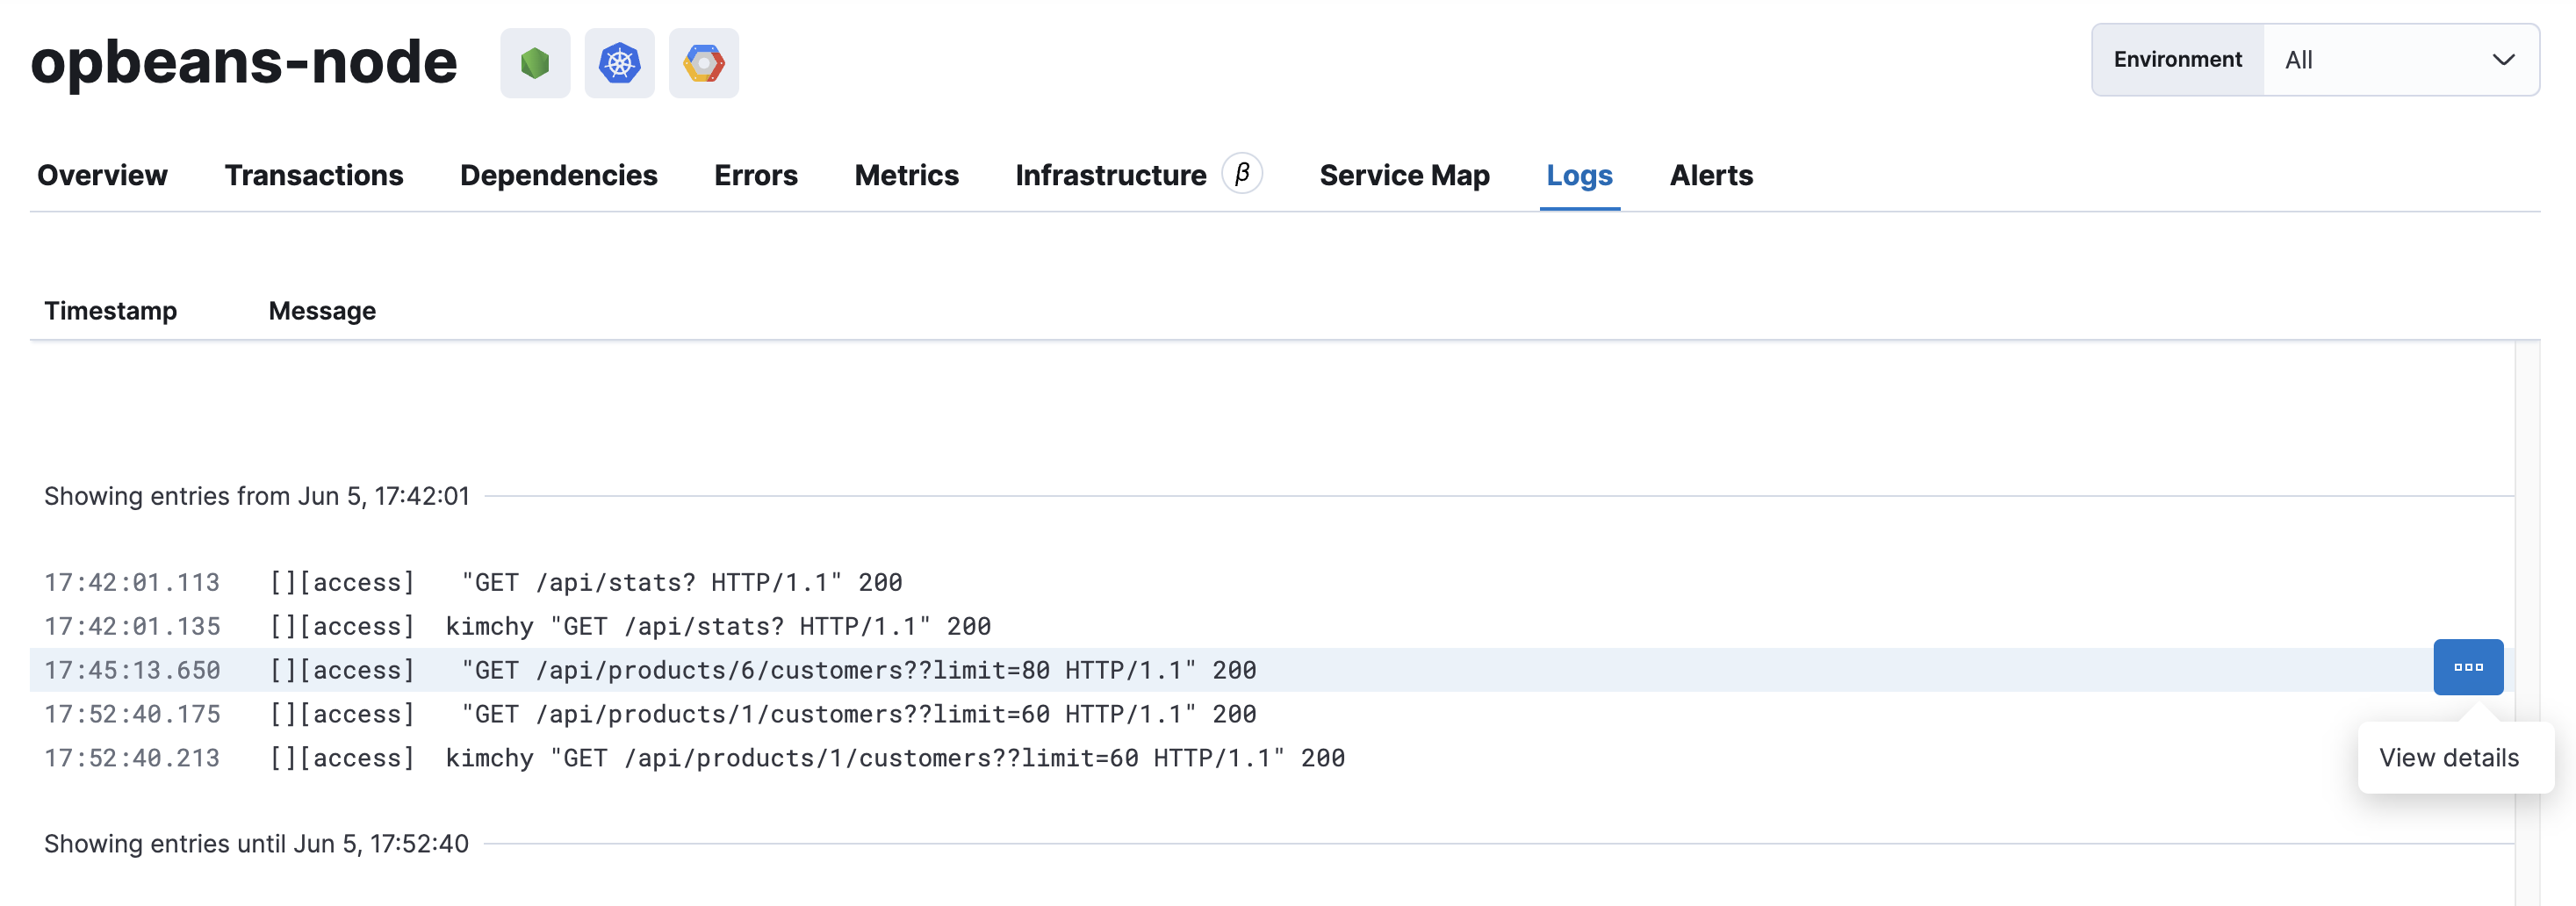
editThe Logs tab shows contextual logs for the selected service.
Logs provide detailed information about specific events, and are crucial to successfully debugging slow or erroneous transactions.
If you’ve correlated your application’s logs and traces, you never have to search for relevant data; it’s already available to you. Viewing log and trace data together allows you to quickly diagnose and solve problems.
To learn how to correlate your logs with your instrumented services, see log correlation

Logs displayed on this page are filtered on service.name
Integrate with logging frameworks
editElastic APM integrates with popular logging frameworks, making it easy to correlate your logs and traces. This enables you to:
- View the context of a log and the parameters provided by a user
- View all logs belonging to a particular trace
- Easily move between logs and traces when debugging application issues
See the Stream application logs guide to get started.
On this page