Monitor log data set quality
editMonitor log data set quality
edit[beta] This functionality is in beta and is subject to change. The design and code is less mature than official GA features and is being provided as-is with no warranties. Beta features are not subject to the support SLA of official GA features.
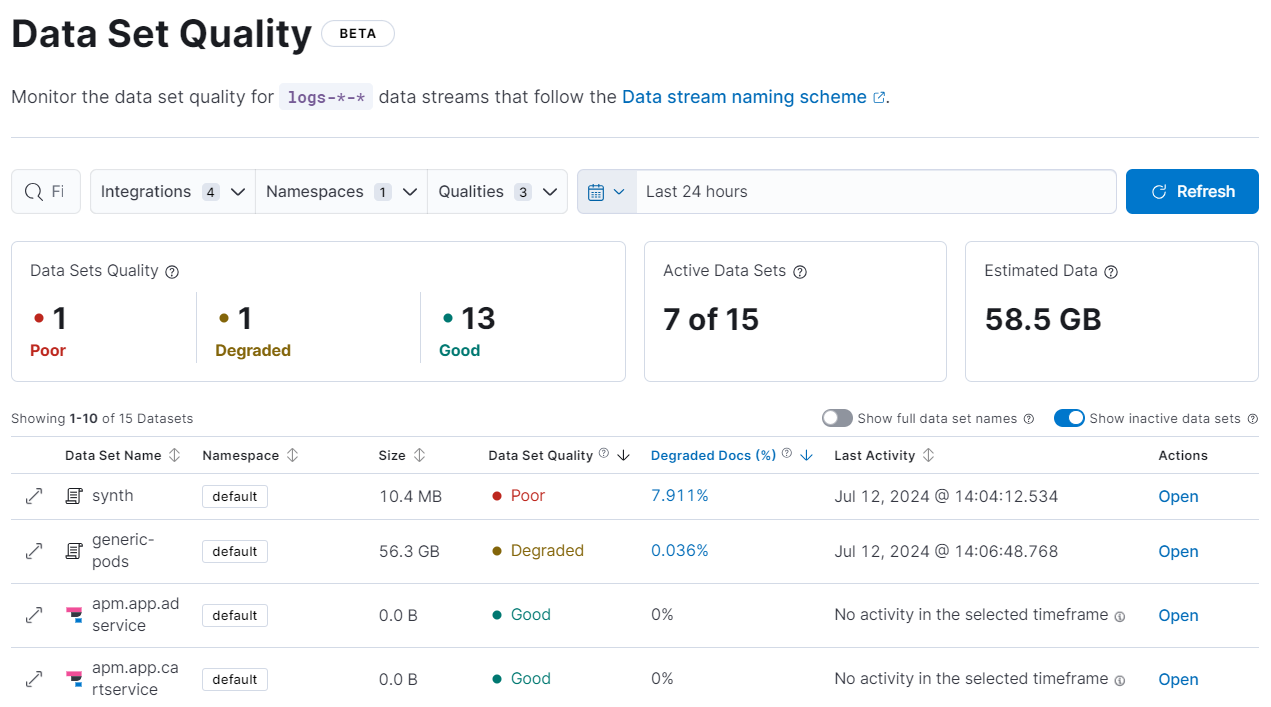
The Data Set Quality page provides an overview of your log data sets. Use this information to get an idea of your overall log data set quality and find data sets that contain incorrectly parsed documents. Access the Data Set Quality page from the main Kibana menu at Stack Management → Data Set Quality.
Requirements
Users with the viewer role can view the Data Sets Quality summary. To view the Active Data Sets and Estimated Data summaries, users need the monitor index privilege for the logs-*-* index.
The quality of your data sets is based on the percentage of degraded documents in each data set. A degraded document in a data set contains the _ignored property because one or more of its fields were ignored during indexing. Fields are ignored for a variety of reasons. For example, when the ignore_malformed parameter is set to true, if a document field contains the wrong data type, the malformed field is ignored and the rest of the document is indexed.
From the data set table, you’ll find information for each data set such as its namespace, size, when the data set was last active, and the percentage of degraded docs. The percentage of degraded documents determines the data set’s quality according to the following scale:
-
Good (
 ): 0% of the documents in the data set are degraded.
-
Degraded (
 ): Greater than 0% and up to 3% of the documents in the data set are degraded.
-
Poor (
 ): Greater than 3% of the documents in the data set are degraded.
Opening the details of a specific data set shows the degraded documents history, a summary for the data set, and other details that can help you determine if you need to investigate any issues.
Investigate issues
editThe Data Set Quality page has a couple of different ways to help you find ignored fields and investigate issues. From the data set table, you can expand a data set’s details, and view commonly ignored fields and information about those fields. You can also open a data set in Logs Explorer to find ignored fields in individual logs.
Find ignored fields in data sets
editTo expand the details of a data set with poor or degraded quality and view ignored fields:
-
From the data set table, click
 next to a data set with poor or degraded quality.
- From the details, scroll down to Degraded fields.
The Degraded fields section shows fields that have been ignored, the number of documents that contain ignored fields, and the timestamp of last occurrence of the field being ignored.
Find ignored fields in individual logs
editTo use Logs Explorer to find ignored fields in individual logs:
- Find data sets with degraded documents using the Degraded Docs column of the data sets table.
- Click the percentage in the Degraded Docs column to open the data set in Logs Explorer.
The Documents table in Logs Explorer is automatically filtered to show documents that were not parsed correctly. Under the actions column, you’ll find the degraded document icon.
Now that you know which documents contain ignored fields, examine them more closely to find the origin of the issue:
-
Under the actions column, click to open the log details.
- Select the JSON tab.
-
Scroll towards the end of the JSON to find the
ignored_field_values.
Here, you’ll find all of the _ignored fields in the document and their values, which should provide some clues as to why the fields were ignored.