- Observability: other versions:
- What is Elastic Observability?
- What’s new in 8.15
- Get started
- Observability AI Assistant
- Application performance monitoring (APM)
- Self manage APM Server
- Data Model
- Features
- Navigate the APM UI
- Perform common tasks in the APM UI
- Configure APM agents with central config
- Control access to APM data
- Create an alert
- Create and upload source maps (RUM)
- Create custom links
- Filter data
- Find transaction latency and failure correlations
- Identify deployment details for APM agents
- Integrate with machine learning
- Explore mobile sessions with Discover
- Observe Lambda functions
- Query your data
- Storage Explorer
- Track deployments with annotations
- Use OpenTelemetry
- Manage storage
- Configure
- Advanced setup
- Secure communication
- Monitor
- APM Server API
- APM UI API
- Troubleshoot
- Upgrade
- Release notes
- Known issues
- Log monitoring
- Infrastructure monitoring
- AWS monitoring
- Azure monitoring
- Synthetic monitoring
- Get started
- Scripting browser monitors
- Configure lightweight monitors
- Manage monitors
- Work with params and secrets
- Analyze monitor data
- Monitor resources on private networks
- Use the CLI
- Configure projects
- Multi-factor Authentication
- Configure Synthetics settings
- Grant users access to secured resources
- Manage data retention
- Use Synthetics with traffic filters
- Migrate from the Elastic Synthetics integration
- Scale and architect a deployment
- Synthetics support matrix
- Synthetics Encryption and Security
- Troubleshooting
- Uptime monitoring
- Real user monitoring
- Universal Profiling
- Alerting
- Service-level objectives (SLOs)
- Cases
- CI/CD observability
- Troubleshooting
- Fields reference
- Tutorials
Errors
editErrors
editErrors are groups of exceptions with a similar exception or log message.
The Errors overview provides a high-level view of the exceptions that APM agents catch, or that users manually report with APM agent APIs. Like errors are grouped together to make it easy to quickly see which errors are affecting your services, and to take actions to rectify them.
A service returning a 5xx code from a request handler, controller, etc., will not create an exception that an APM agent can catch, and will therefore not show up in this view.

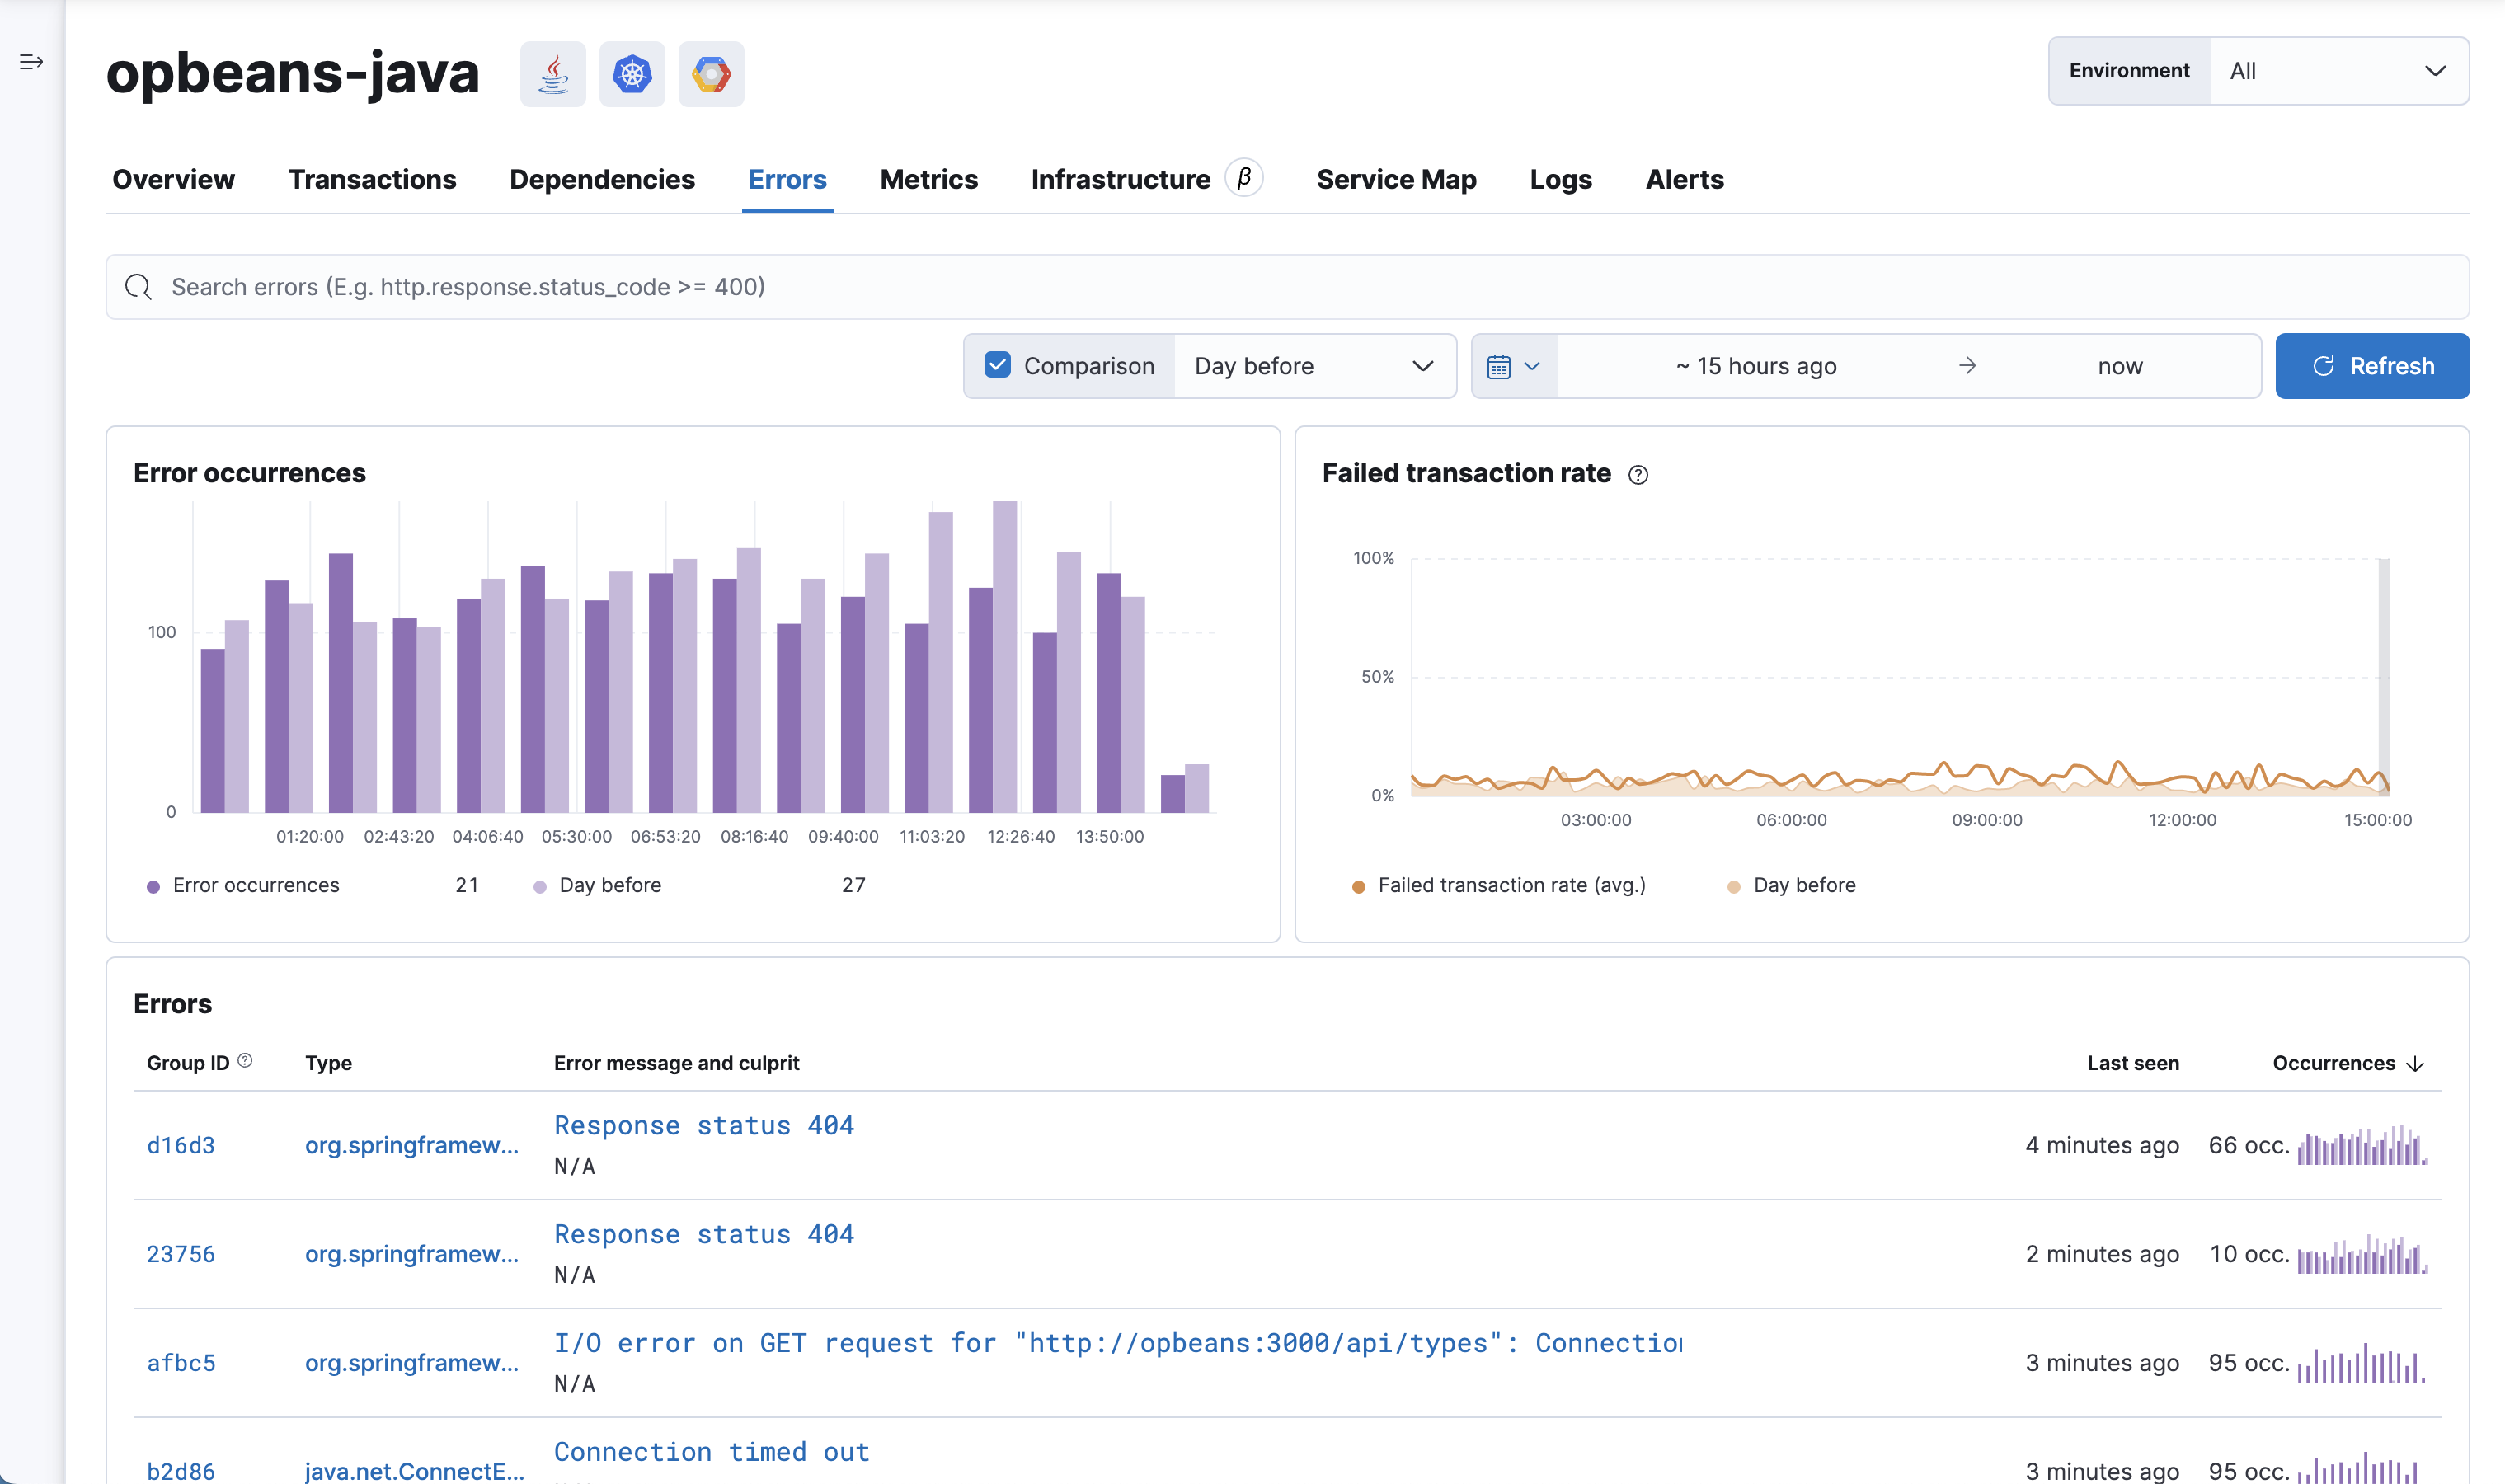
Selecting an error group ID or error message brings you to the Error group.

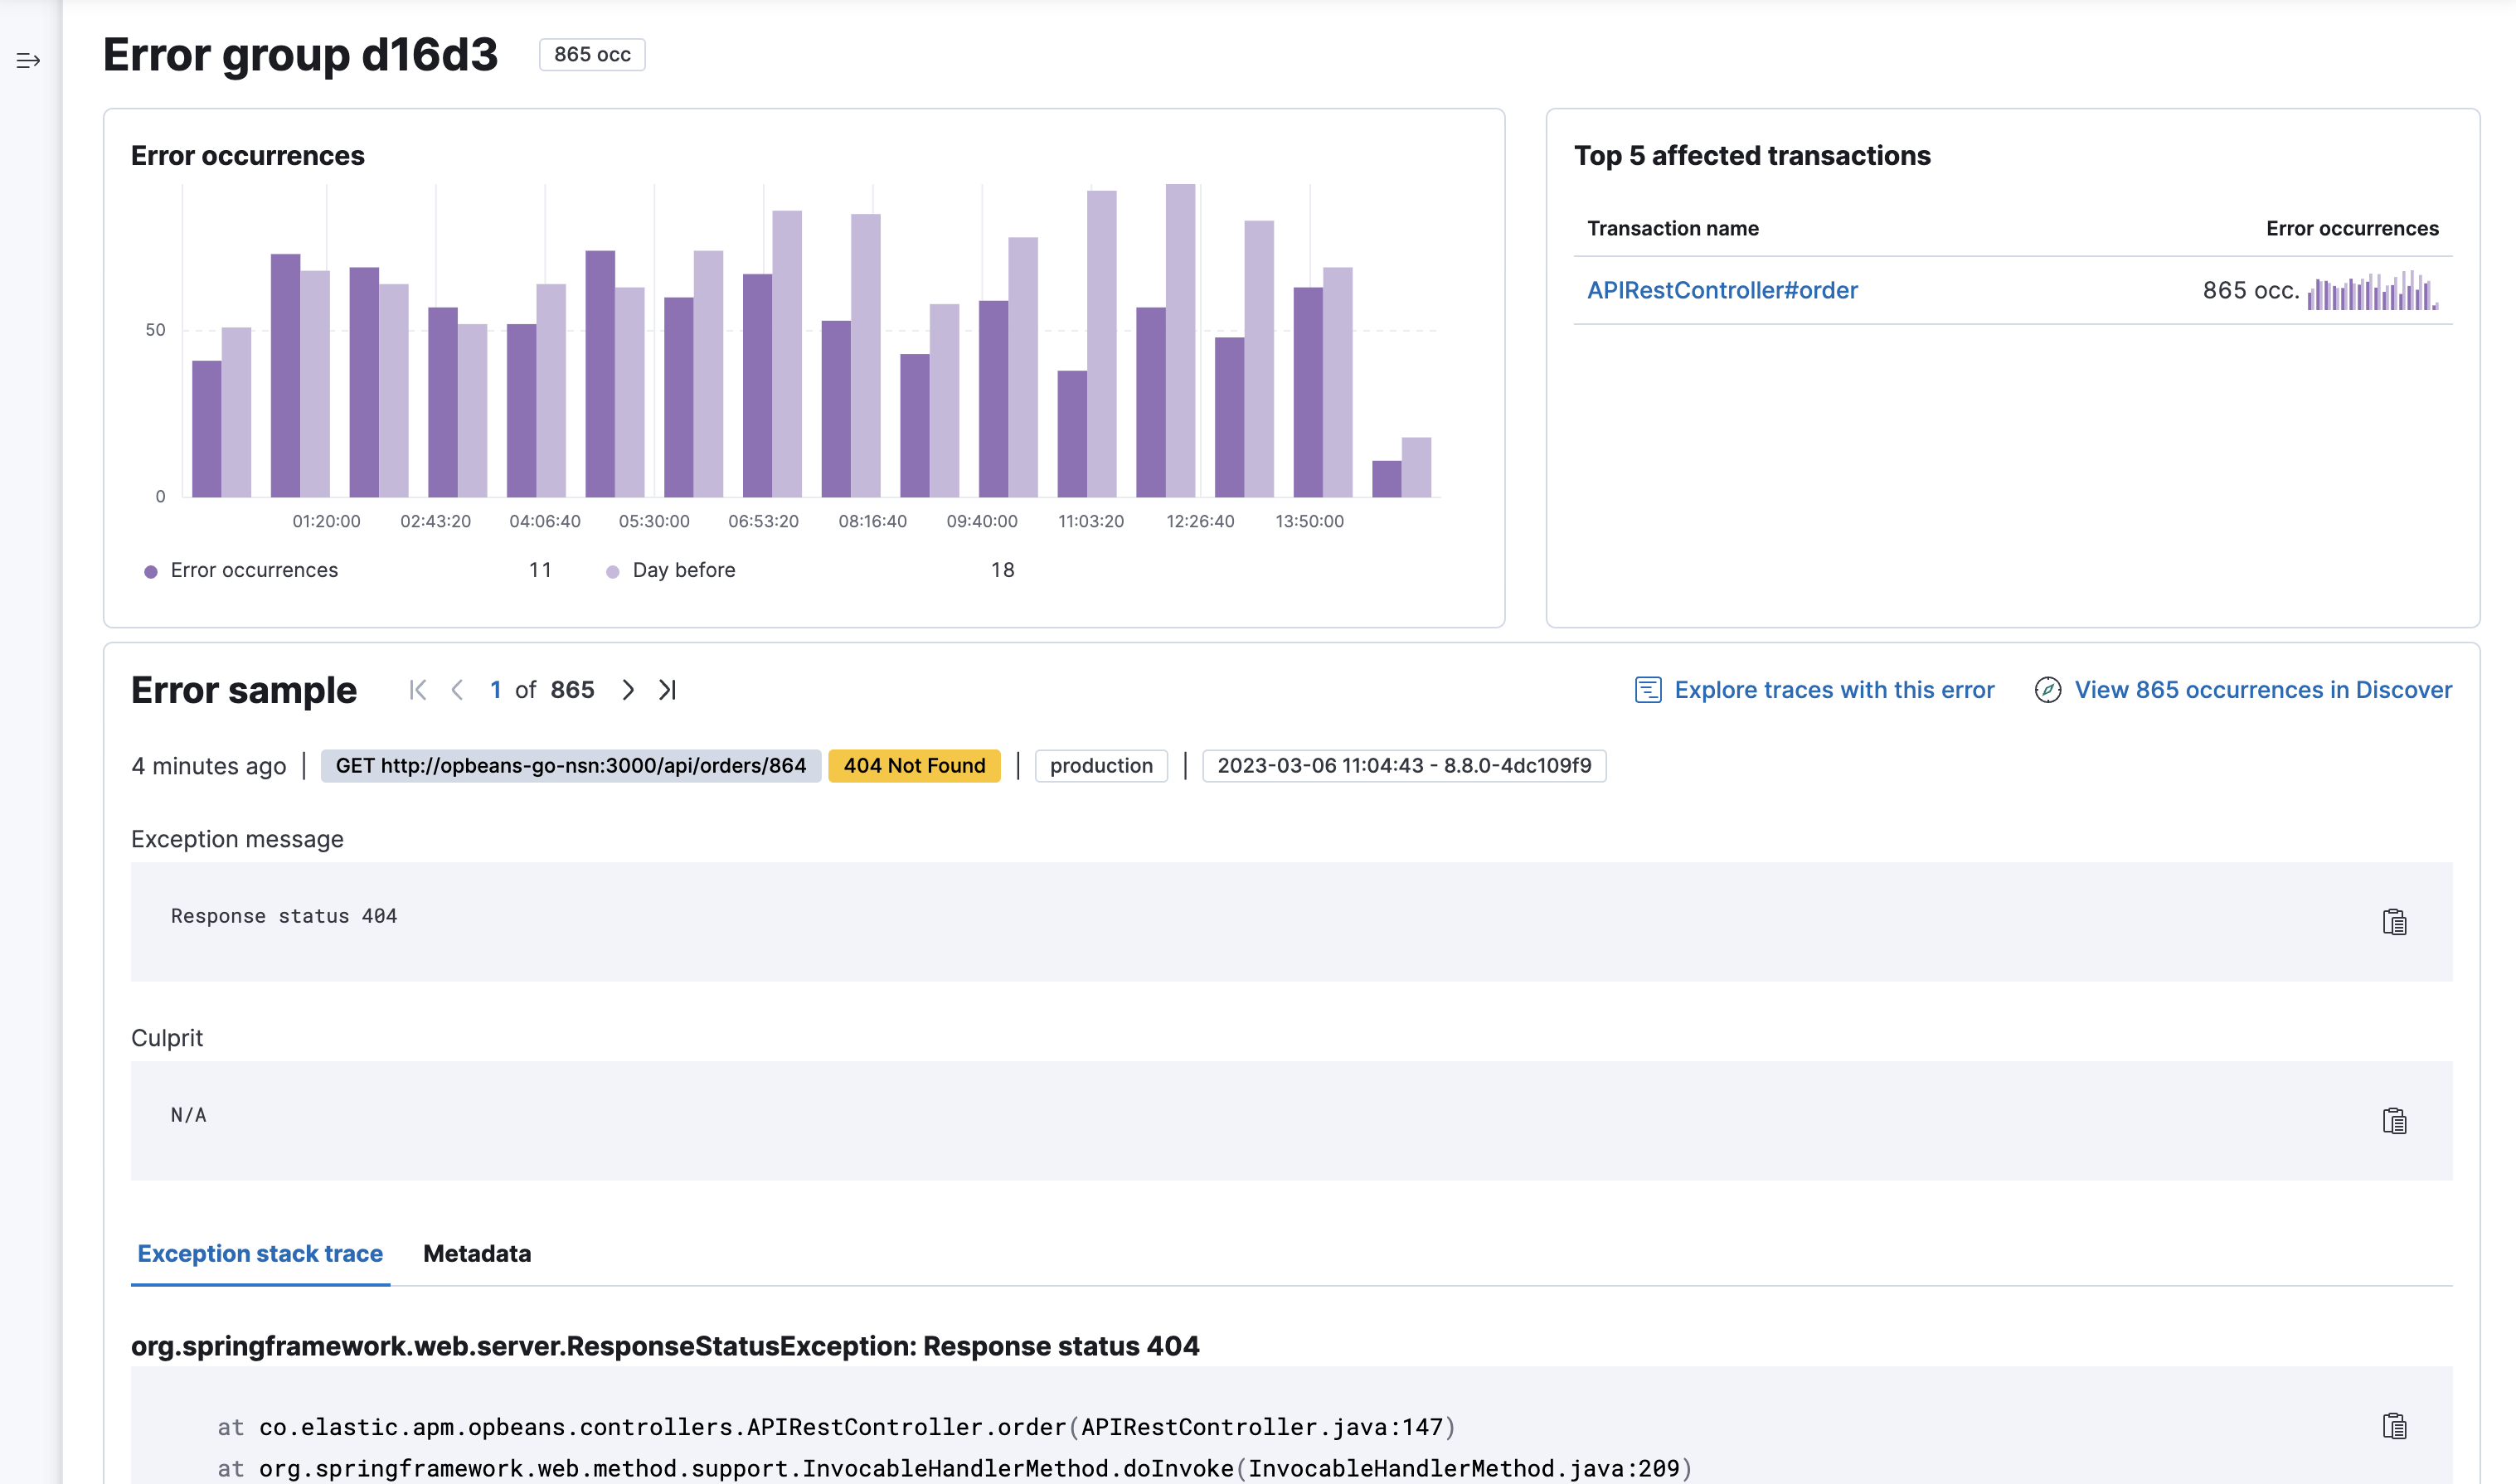
The error group details page visualizes the number of error occurrences over time and compared to a recent time range. This allows you to quickly determine if the error rate is changing or remaining constant. You’ll also see the top 5 affected transactions—enabling you to quickly narrow down which transactions are most impacted by the selected error.
Further down, you’ll see an Error sample. The error shown is always the most recent to occur. The sample includes the exception message, culprit, stack trace where the error occurred, and additional contextual information to help debug the issue—all of which can be copied with the click of a button.
In some cases, you might also see a Transaction sample ID. This feature allows you to make a connection between the errors and transactions, by linking you to the specific transaction where the error occurred. This allows you to see the whole trace, including which services the request went through.