Lightweight synthetic monitoring
editLightweight synthetic monitoring
edit
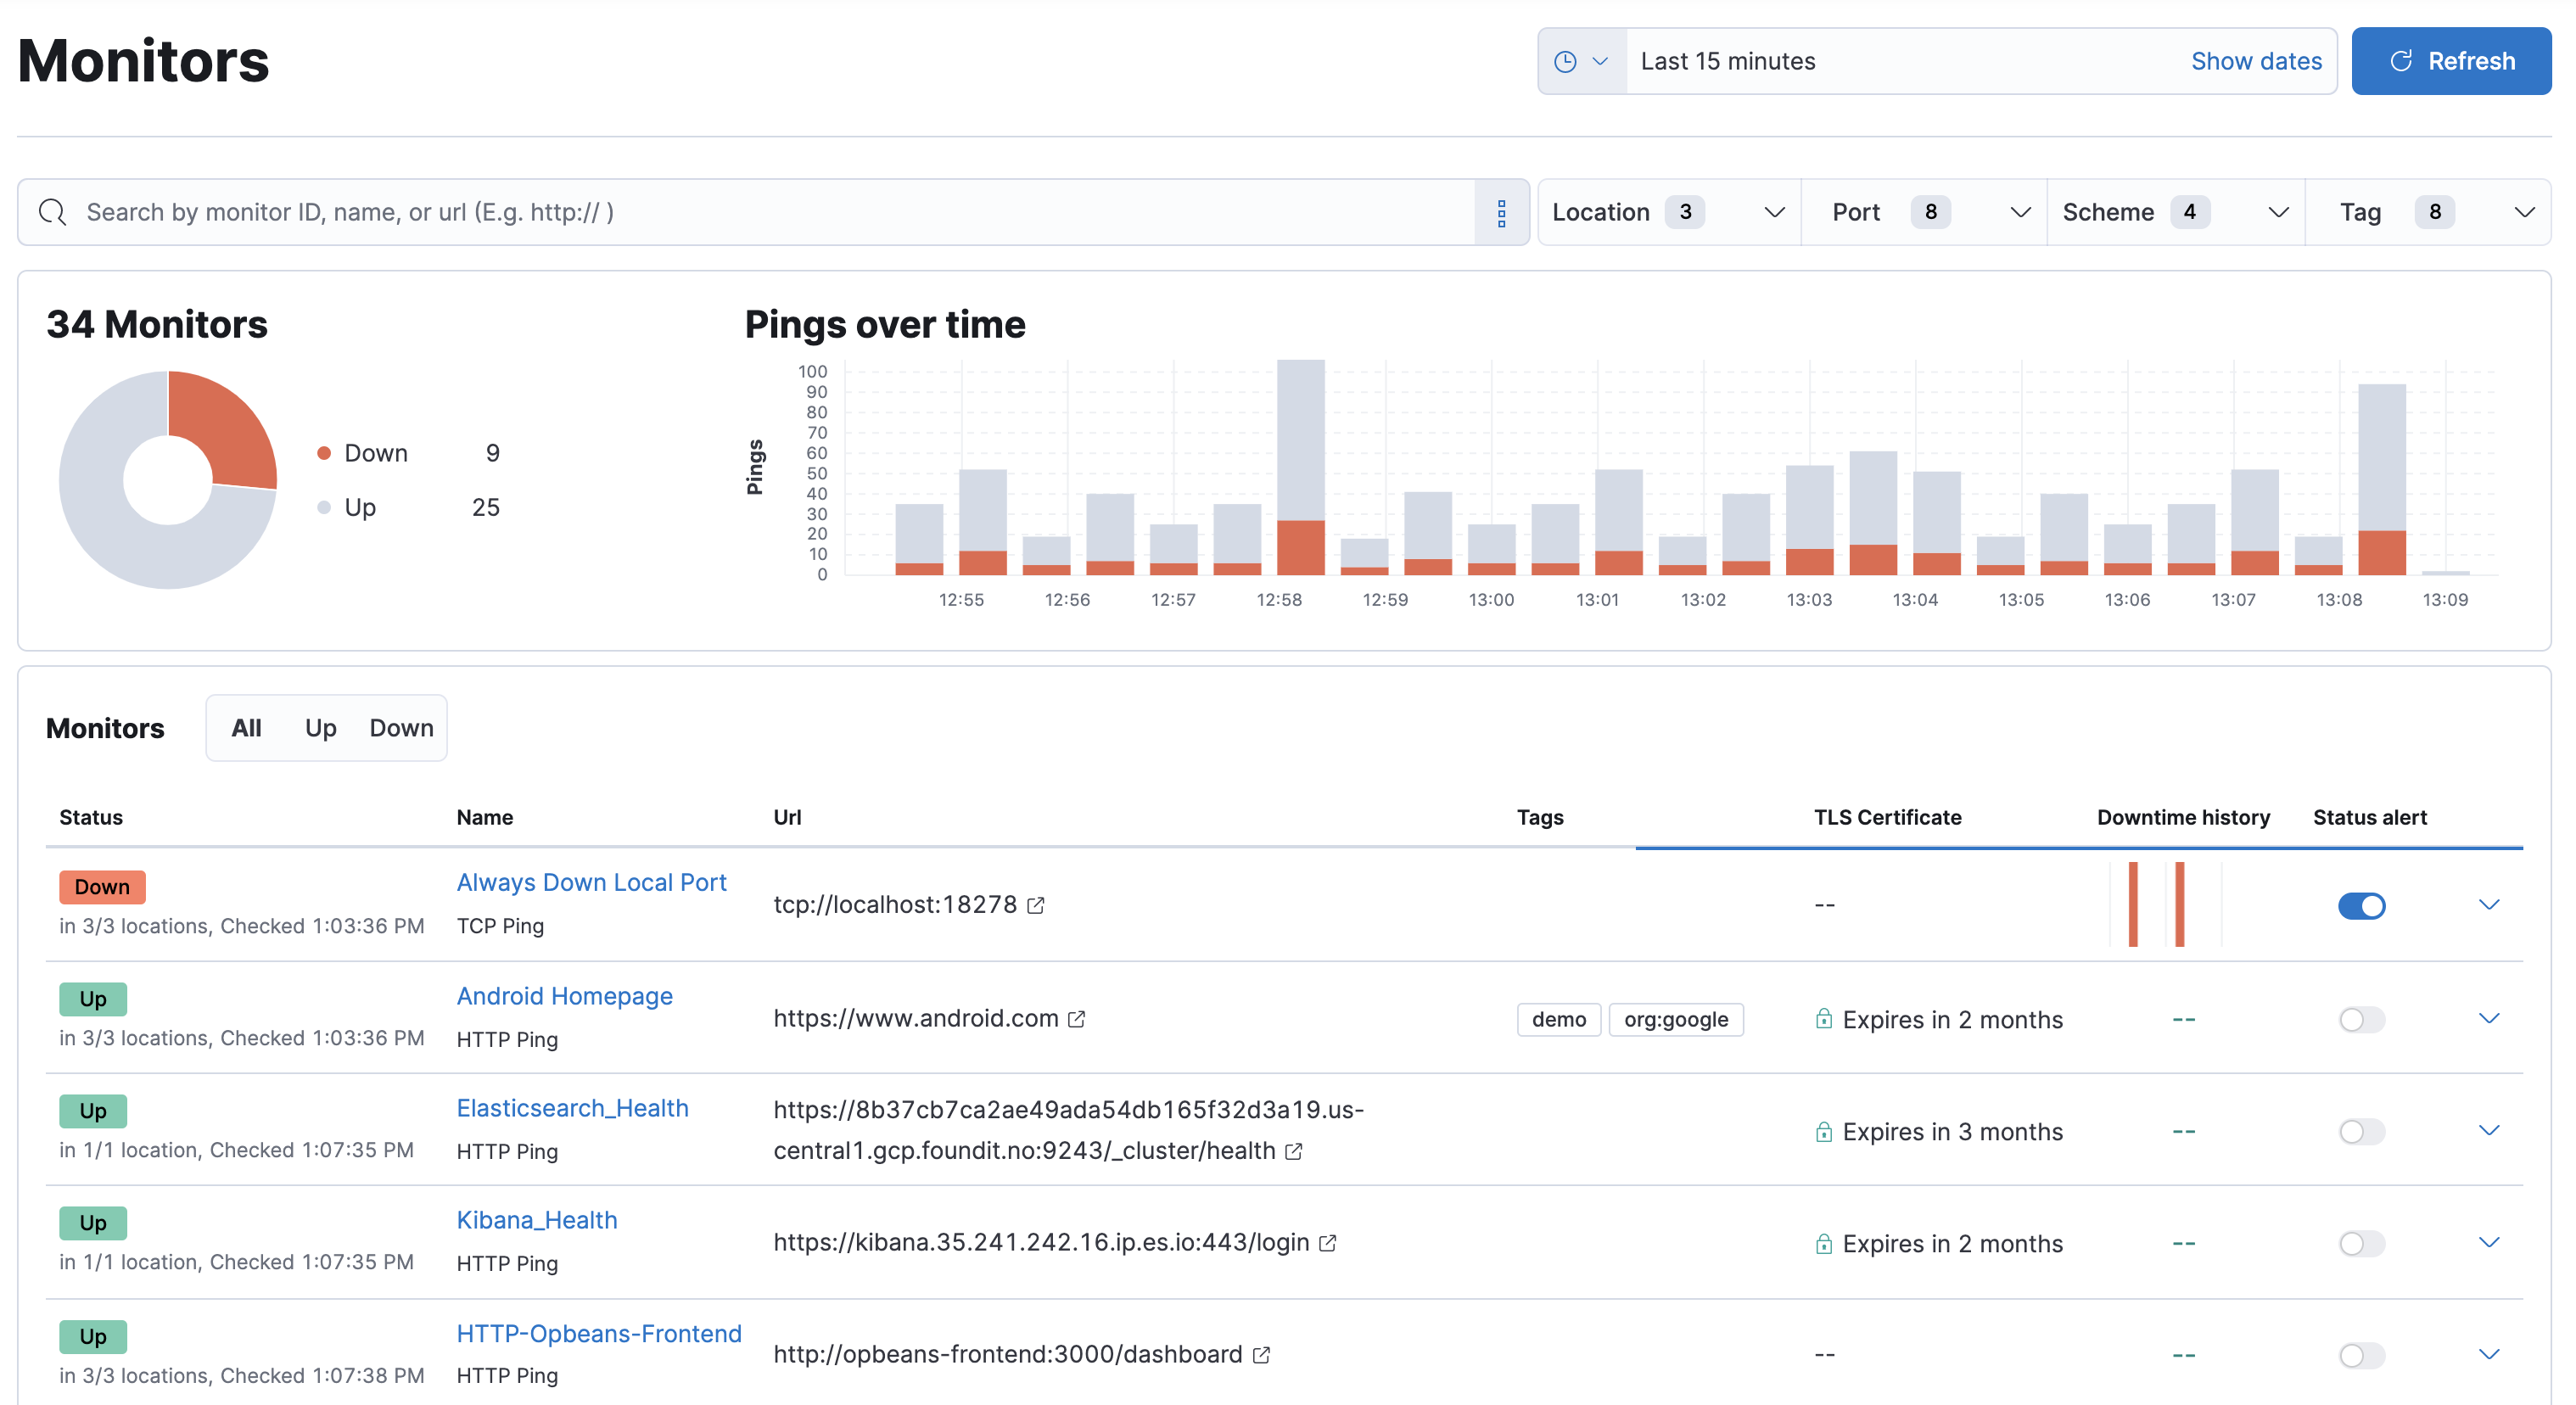
The Uptime app uses Elastic Agent to check the status of your services and applications periodically. By adding the Elastic Synthetics integration to the policy used by your agent, you can monitor the availability of network endpoints and services using the following Uptime monitors:
ICMP monitor |
Check the availability of your hosts. The ICMP monitor uses ICMP (v4 and v6) Echo Requests to check the network reachability of the hosts you are pinging. This will tell you whether the host is available and connected to the network. However, it doesn’t tell you if a service on the host is running or not. |
TCP monitor |
Monitor the services running on your hosts. The TCP monitor checks individual ports to ensure the service is accessible and running. |
HTTP monitor |
Monitor your website. The HTTP monitor checks to ensure specific endpoints return the correct status code and display the correct text. |
Browser monitor |
Using the synthetics agent, run automated synthetic monitoring test suites on a real Chromium browser. For more details, refer to Real browser synthetic monitoring. In version If you want to use browser checks, we highly recommend using the latest version of browser checks available in |
Along with getting notified when your TLS certificates are set to expire, you can also create an Uptime duration anomaly rule to receive notifications based on the response durations for all of the geographic locations of each monitor.