What’s new in 7.14
editWhat’s new in 7.14
editHere are the highlights of what’s new and improved in 7.14.
Other versions: 7.13 | 7.12 | 7.11 | 7.10 | 7.9 | 7.8 | 7.7 | 7.6 | 7.5 | 7.4
Give 7.14 a try
editTry 7.14 now by deploying Elasticsearch and Kibana on Elastic Cloud or by downloading them.
Elastic Agent, Fleet, and Integrations now generally available (GA)
editTo make it easier to integrate your systems and applications with the Elastic Stack, we are excited to announce three significant improvements in the 7.14 release.
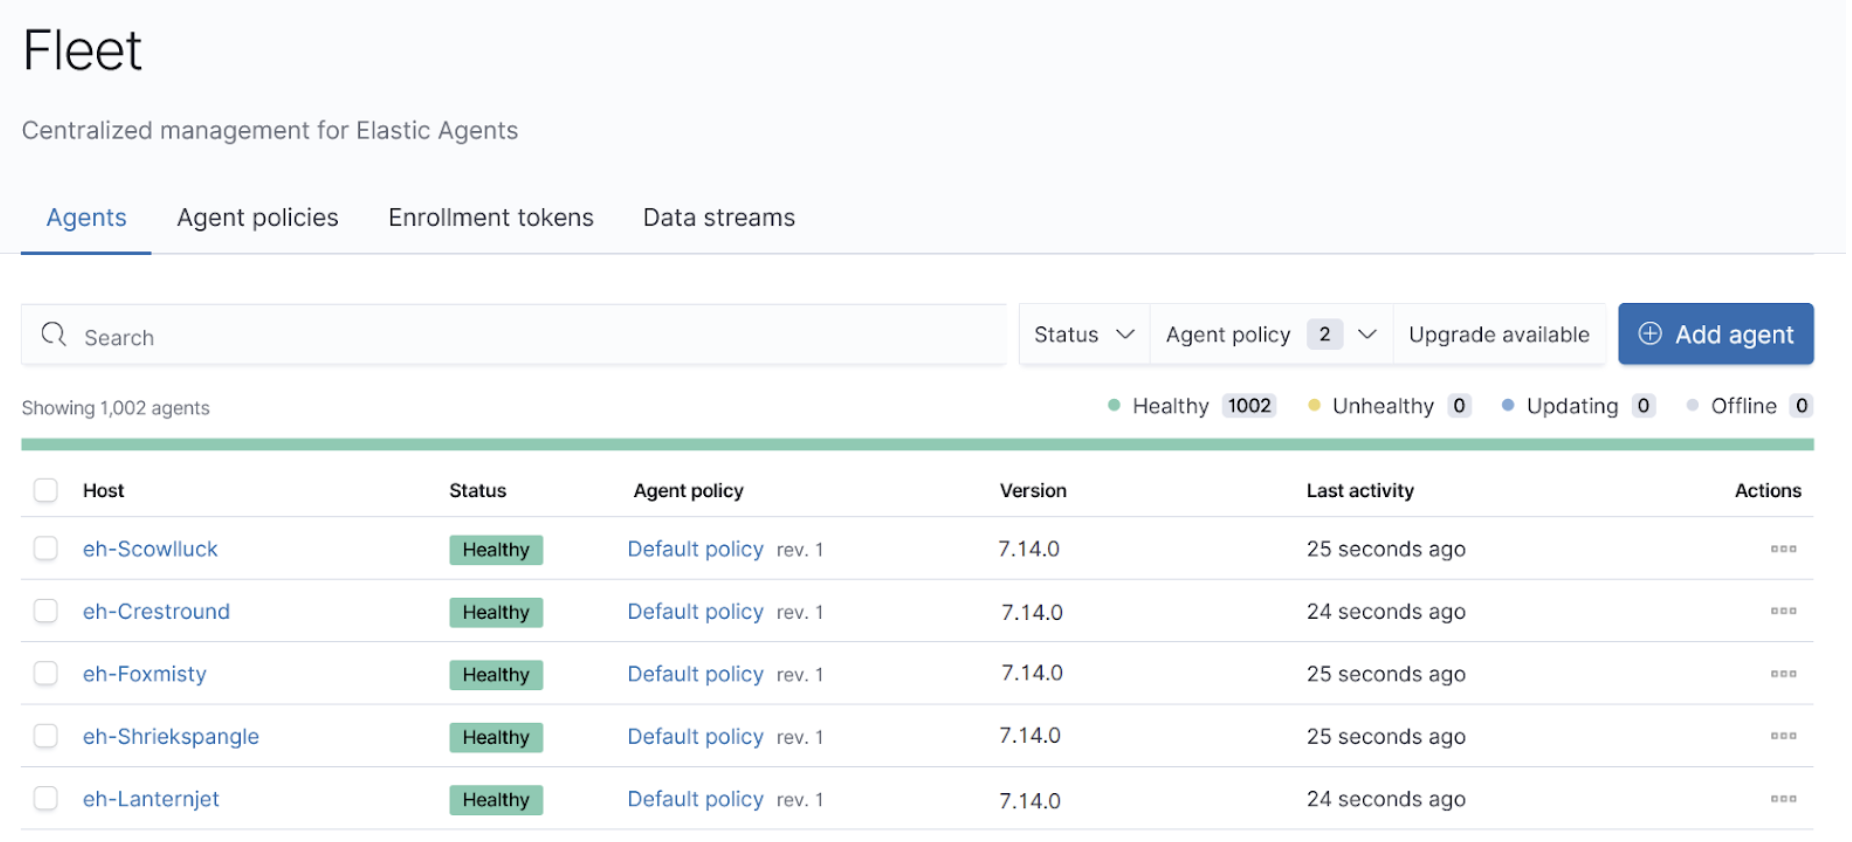
First, we are launching the generally available (GA) release of our Elastic Agent, a single, unified agent for Observability and Security. With fewer things to configure and install, a single agent will simplify data onboarding.
Second, we are launching the GA release of Fleet, which lets you centrally manage an entire fleet of Elastic Agents at scale. It acts as a control plane that gives you a real-time view of the agent status. In addition, it allows you to upgrade Elastic Agents remotely, execute queries on each host, and also contain security threats.
Third, we are launching our new Integrations app in Kibana along with our first set of GA Integrations. With a single click, you can integrate your systems and applications with the Elastic Stack.
Integrations provide out-of-the box log parsing, dashboards, machine learning jobs, and more. In addition, you can deploy Integrations on Elastic Agents through Fleet, allowing you to go from data to insights in seconds. Our new GA Integrations enable you to monitor your system infrastructure, including servers, laptops, containers, VMs, and more. You also protect your systems from security threats and analyze security events. There are over 70 Integrations available, and we are continuously working on adding more.
Unenrollment timeout in Fleet
editElastic Agents that run in container orchestration environments like ECE or Kubernetes should be stateless by design. When a container is removed, the agent API keys are deleted. This results in an orphan agent tracked in Fleet.
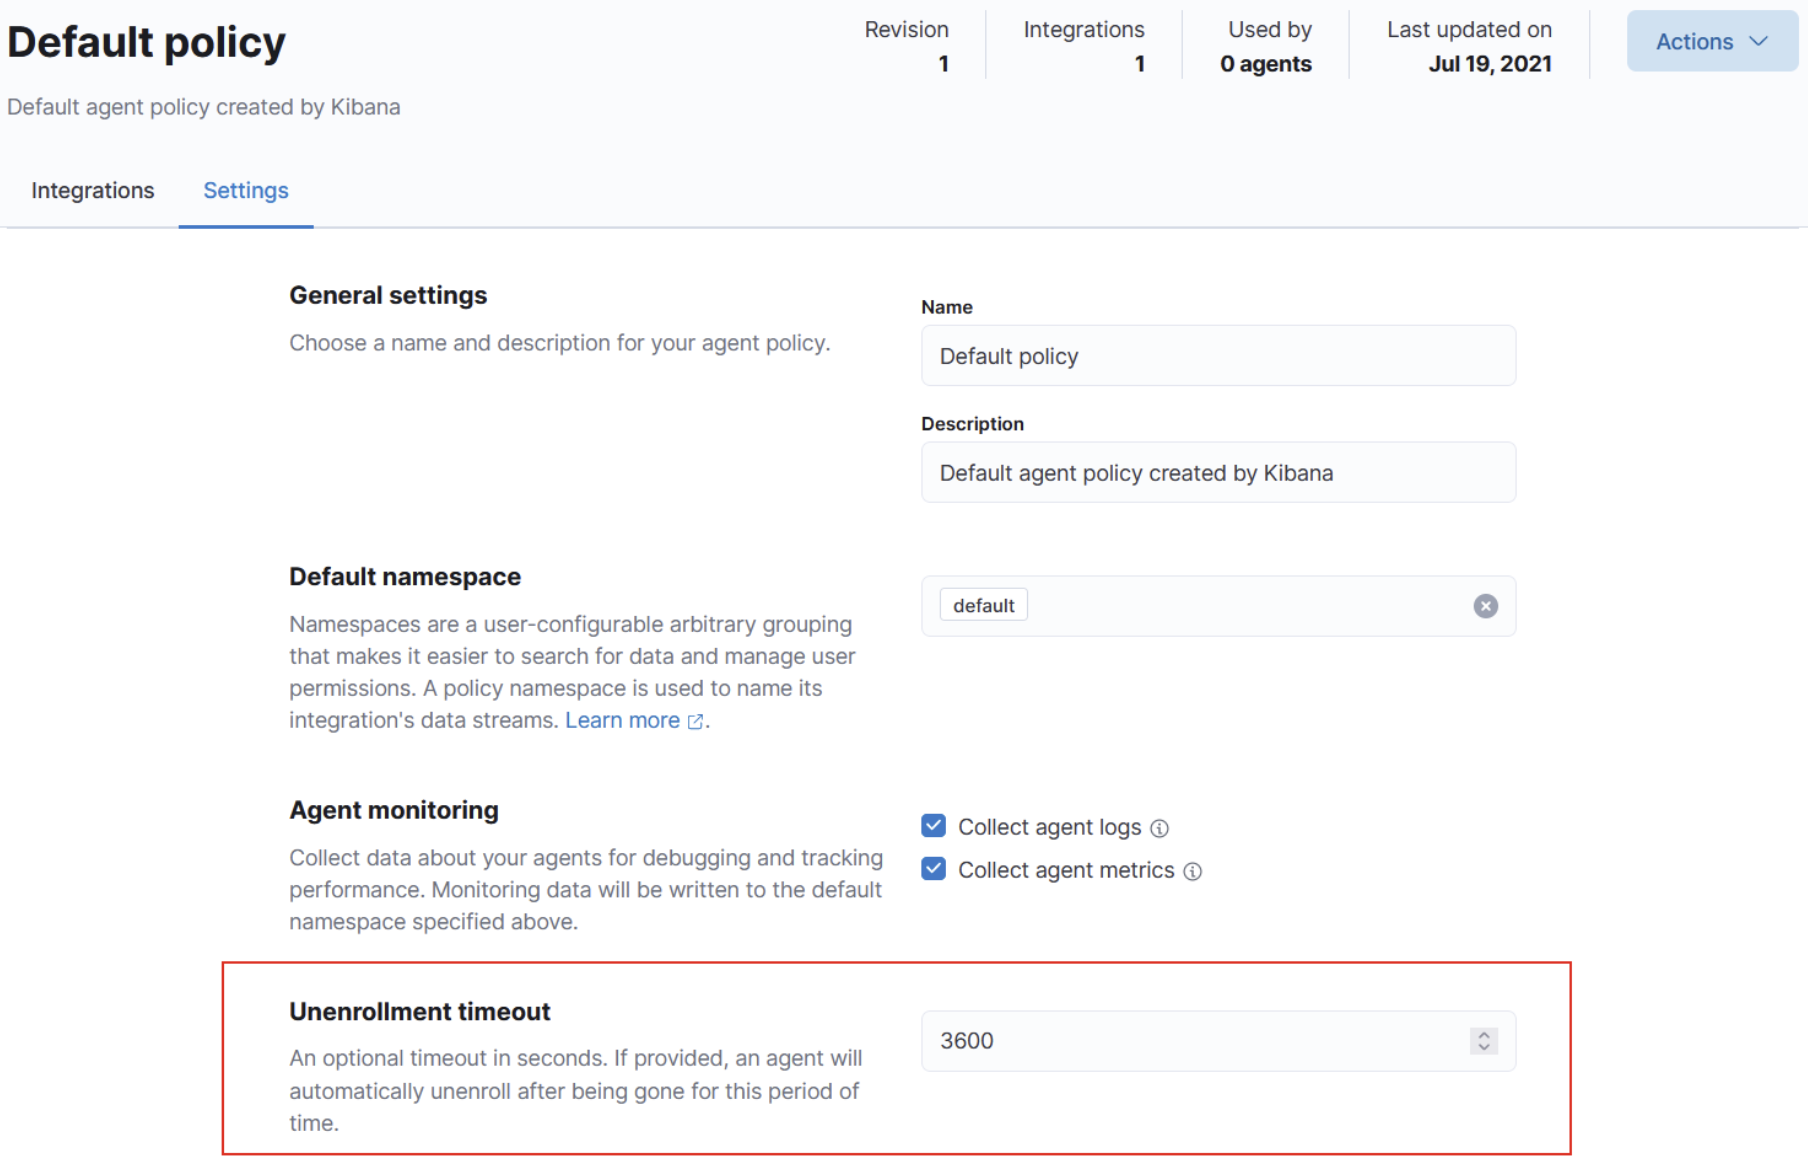
Within an agent policy, you can now specify an unenroll timeout to automatically unenroll an Elastic Agent when it does not check into Fleet for a period of time. This allows the Elastic Agent to resume if the service or network recovers within the time window. After that, the Elastic Agent will have to enroll again.
Removing Beats central management
editBeats Central Management was an old solution for centrally managing Beats. It was released as a beta and was deprecated several releases ago. We are now removing it from Kibana. We recommend that you switch to our new GA release of Fleet instead.
Advanced metrics collection from Couchbase Sync Gateway
editFor 7.14, we’re enhancing the Couchbase integration with support for an extended list of metrics. You can now use the Couchbase module in Metricbeat to collect server metrics from Sync Gateway.
The module uses the Metricbeat Couchbase input to get additional metrics related to resources, cache, database, delta sync, doc imports, CBL replication, security, and GSI views. With these expanded metrics, we have made sure that only the essential metrics are collected to keep the consumption of resources appropriate.
Enhanced granularity of the AWS integration
editThe pay-as-you-go model gets applied to each granular component of any cloud IaaS or PaaS to create more advanced cloud offerings. Therefore, it’s essential not to administer and govern the whole cloud but instead focus only on the services you use.
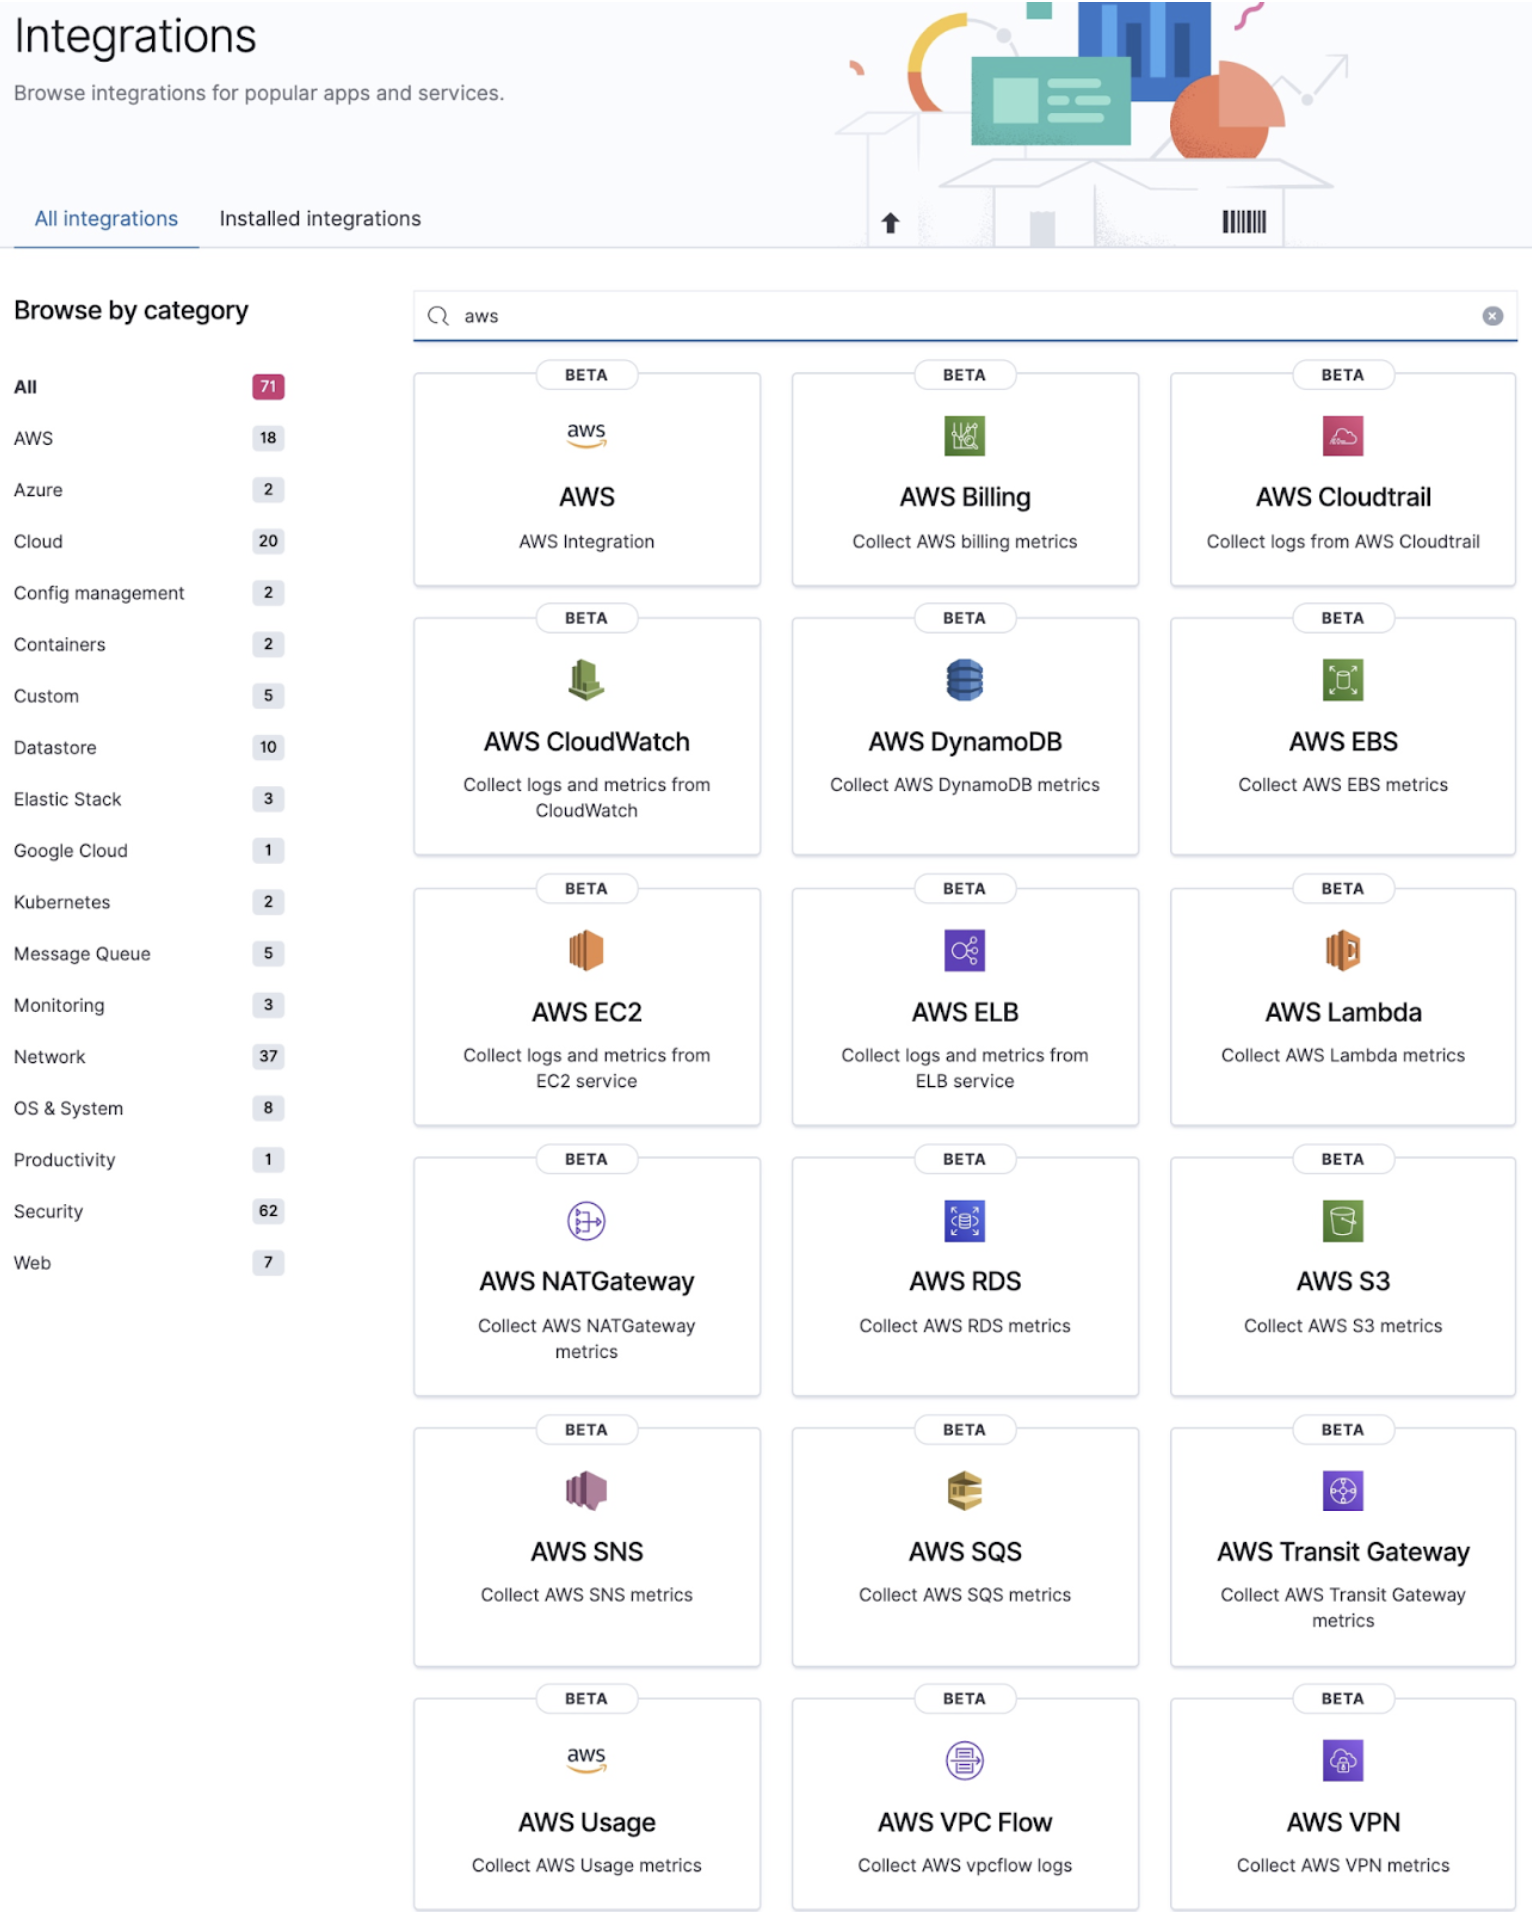
We understand that pain and have updated the list of AWS integrations on the Observability Integrations page, improving the ability to search quickly, configure, and enable integrations for only those AWS services you are interested in. Again, there is no impact on the ability to enable the umbrella AWS integration.
Collect RDS Cluster tags as part of the AWS module in Metricbeat
editWith the number of assets increasing in our public and private cloud accounts, tags are becoming critical. Usage of tags can make it easy to observe aggregate performance across many machines and potentially narrow down the dataset for better comprehension. In addition, you can use tags to add more dimensions to telemetries so they can be sifted, aggregated, and compared in Elastic visualizations for advanced insights.
For 7.14, we are pleased to announce that you can now collect and use RDS Instance tags and Cluster tags as part of the RDS metricset of the AWS module in Metricbeat.
New Amazon Kinesis Data Streams metricset in the Metricbeat AWS module
editSuppose your applications need complex real-time data stream processing. In that case, chances are you’re using Amazon Kinesis Data Streams for the rapid and continuous data intake and aggregation due to its low response times.
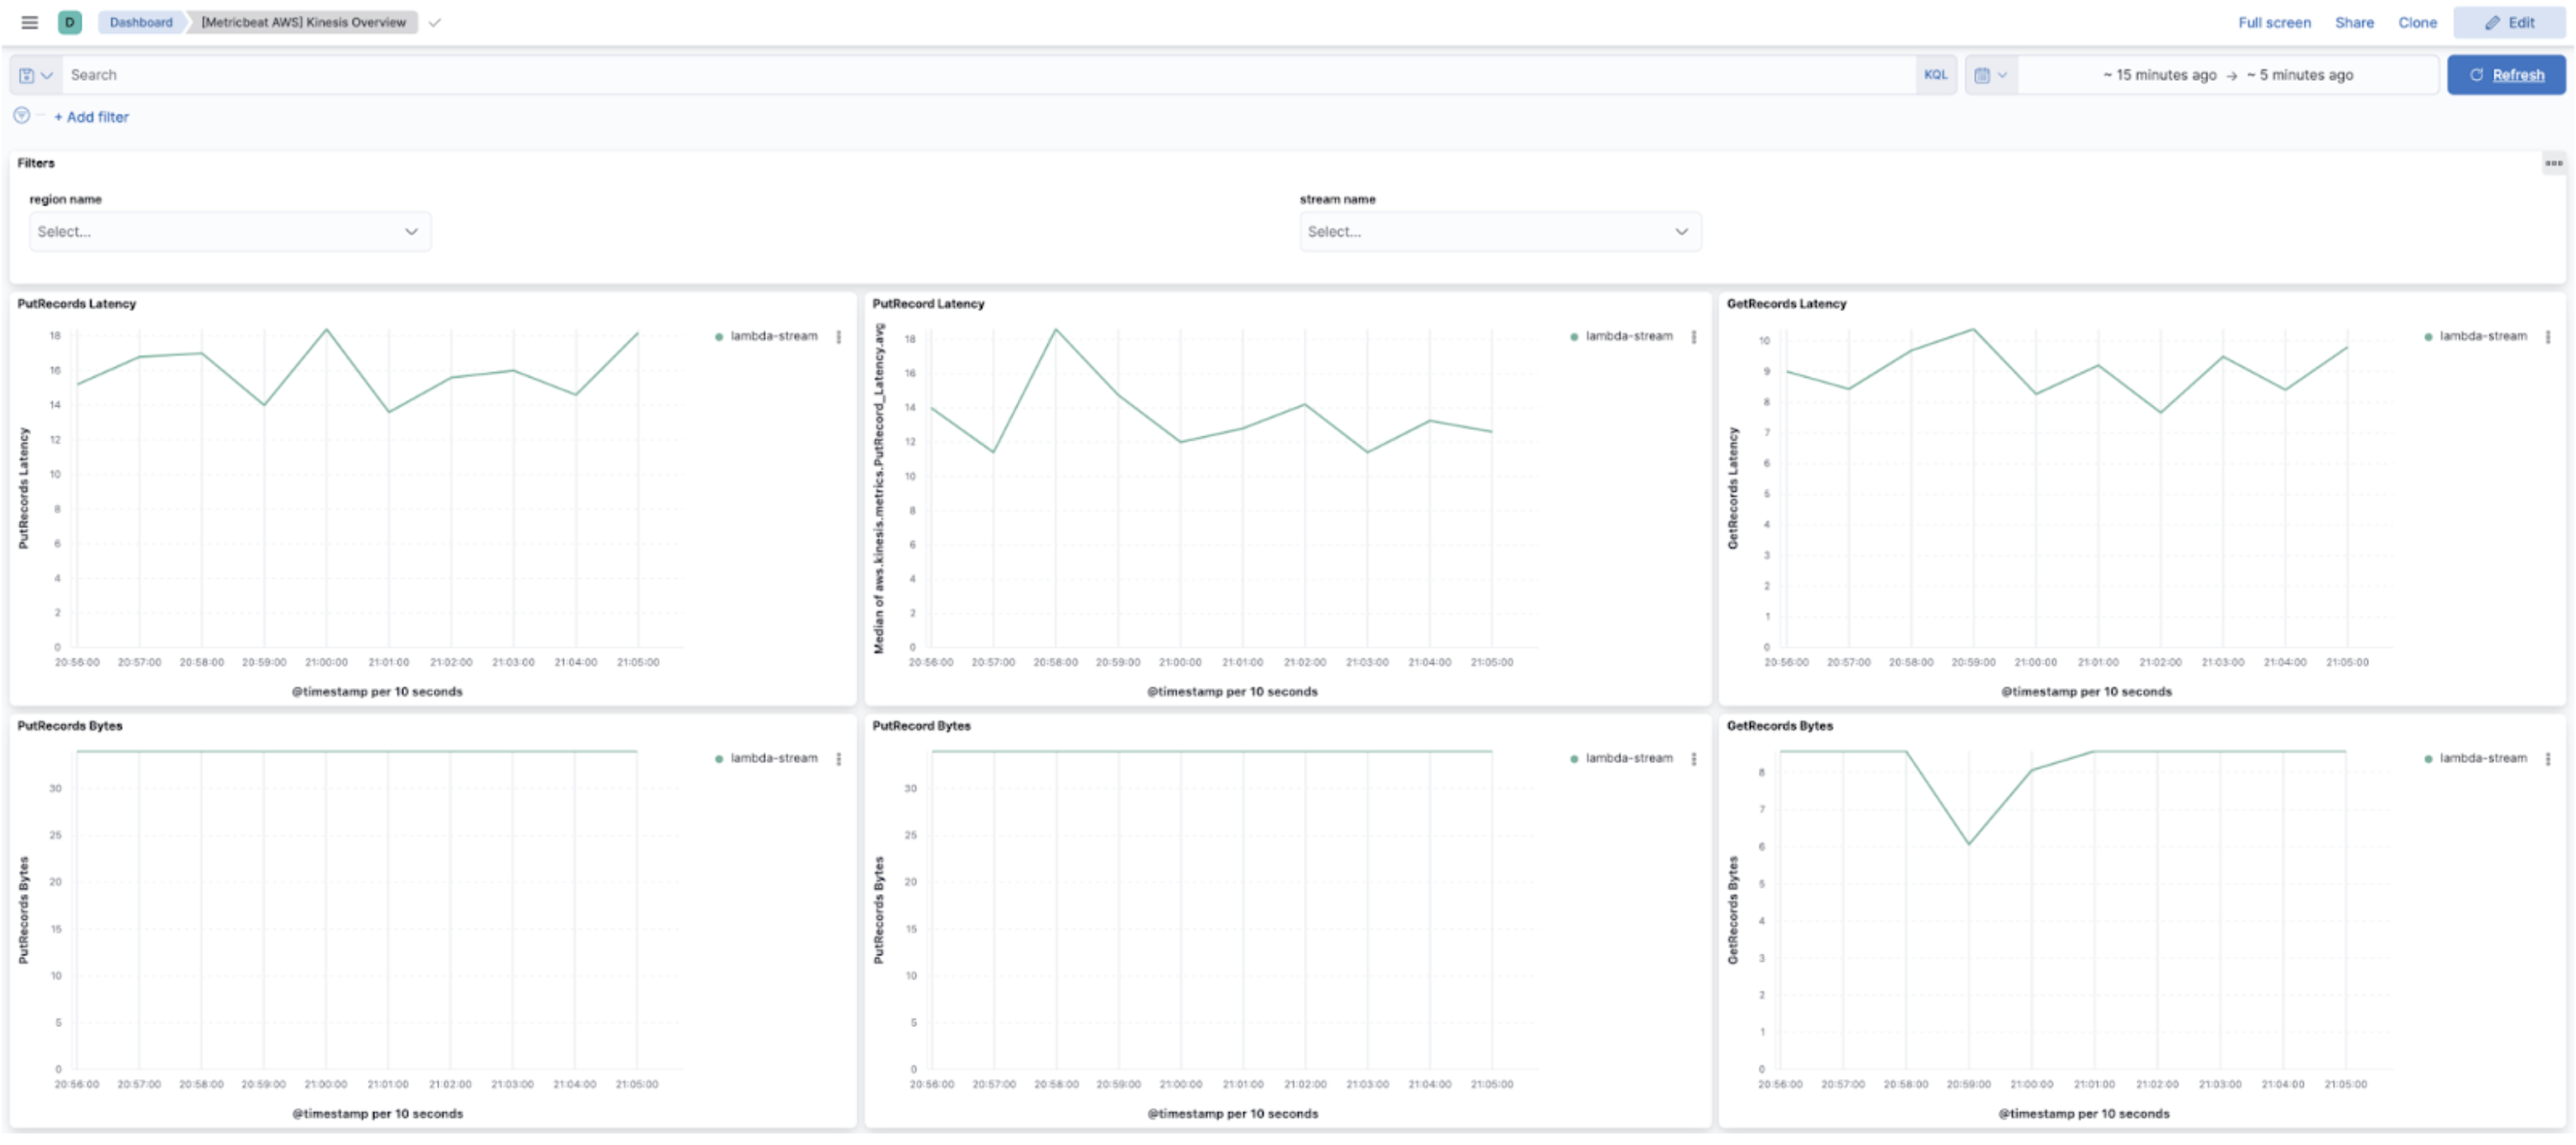
In 7.14, we’ve added the metric collection from Amazon Kinesis Data Stream to our Metricbeat AWS module. The new Amazon Kinesis Data Stream metricset contains all the essential Kinesis monitoring metrics sourced from AWS CloudWatch.
Our AWS module comes with a prebuilt dashboard where you will see your Kinesis data streams and associated key metrics, giving you an overview of all your data streams.
New cluster identifier field for the Kubernetes Metricbeat Integration
editKubernetes is viewed as the de facto standard for orchestrating and managing application containers. So if you use Elastic Observability and run a containerized deployment of applications, we have great news.
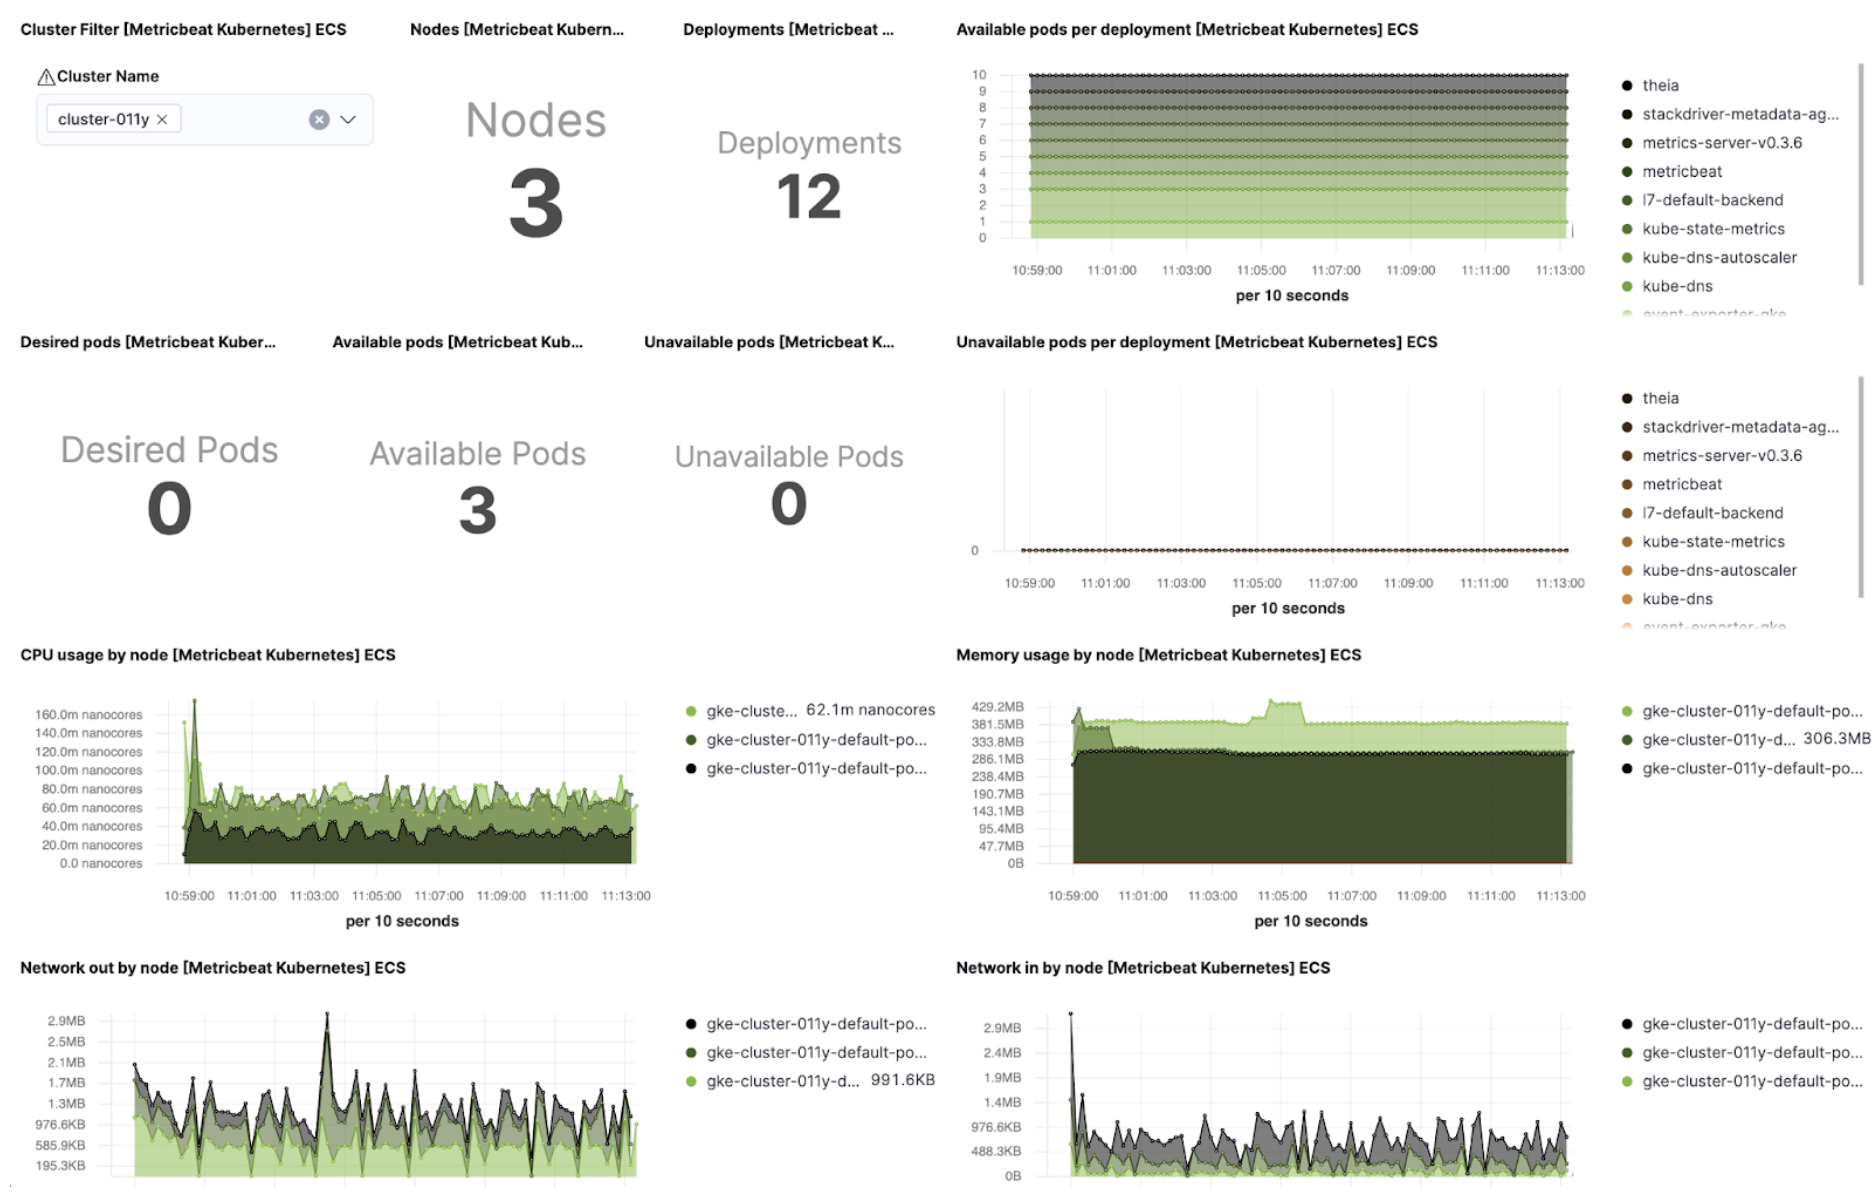
For 7.14, you can now use a cluster identifier to distinguish between multiple Kubernetes clusters when monitoring and visualizing workloads in Elastic Observability. For a holistic view of your deployments, you can also quickly identify which cluster each node and pod belongs to.
Histogram support for OpenTelemetry agents
editHistogram support for OpenTelemetry agents enables you to profile the distribution of measurements for user analytics and troubleshooting. You can now identify subpopulation patterns in your traffic with granular analysis of OpenTelemetry time series data, such as transaction latency, payload size, and business KPIs.
APM transaction correlations (beta)
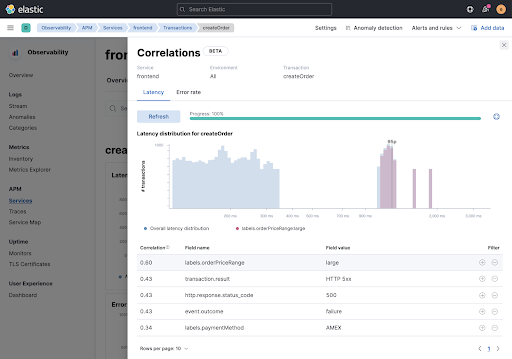
editWith the massive growth in data and dependencies in modern applications, automation and analytics have become essential components of any troubleshooting toolkit. Elastic’s APM correlations feature (beta) accelerates root cause analysis by automatically surfacing attributes of your data set (such as infrastructure components, versions, and locations) that are correlated with high-latency or erroneous transactions and have the most significant impact on your service performance. You can visualize the latency distribution of any attribute compared to overall latency and use these attributes to filter and isolate the root causes of your performance problems.
APM Mobile - iOS support (technical preview)
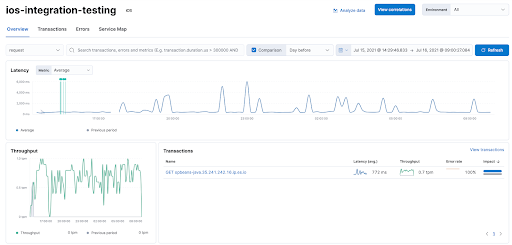
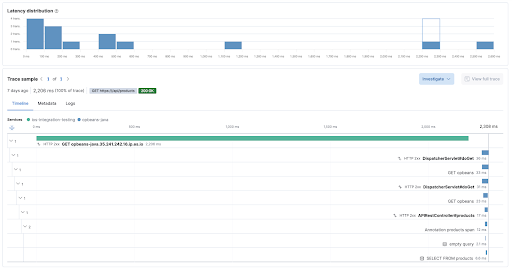
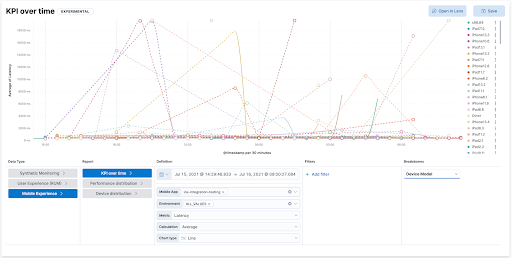
editThis release introduces a technical preview supporting native mobile iOS applications in Elastic APM and RUM products. This functionality is based on the OpenTelemetry iOS SDK (with heavy contributions by the Elastic team). The feature is built directly into APM and RUM to enable use cases such as end-to-end monitoring and tracing from native mobile applications, and ad-hoc analysis of mobile user experience.
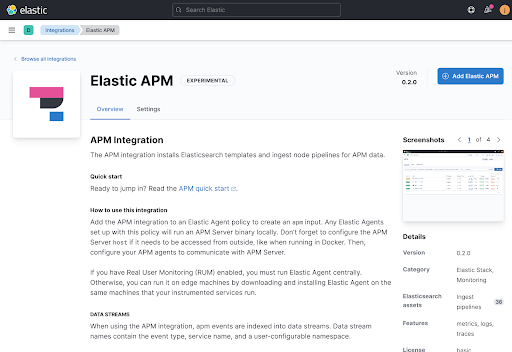
APM Server integration in Fleet (beta)
editThis integration enables users to run an APM Server managed by Elastic Agent and Fleet. The Elastic APM integration uses the new data stream standard to store data.
