Collect Logstash monitoring data for dashboards (Serverless)
editCollect Logstash monitoring data for dashboards (Serverless)
editLogstash monitoring is available on Elastic Cloud Serverless through the Logstash Integration in Elastic Observability. Elastic Agent collects monitoring data from your Logstash instance, sends it directly to Elastic Cloud Serverless, and shows the data in Logstash dashboards.
You’ll need to have an Elastic Observability project. We’ll provide steps to help you create one.
Prerequisite
Disable default collection of Logstash monitoring metrics
The monitoring setting is in the Logstash configuration file (logstash.yml), but is
commented out:
monitoring.enabled: false
Remove the # at the beginning of the line to enable the setting.
Add and configure the Logstash integration
editAdd the Logstash integration
- Log in to your cloud.elastic.co account and create an Observability serverless project.
- Select Get Started from the main menu.
- Select Start exploring (near the bottom of the page).
- On the Integrations page, search for Logstash and select it to see details.
- Click Add Logstash.
- Follow the instructions to install Elastic Agent and add the Logstash integration.
For more info, check out the Elastic Observability docs.
Configure the integration to collect logs
- Make sure that Logs is ON if you want to collect logs from your Logstash instance. Check the settings to be sure that they are configured correctly.
- Modify the log paths to match your Logstash environment.
Configure the integration to collect metrics
- Make sure that Metrics (Stack Monitoring) is OFF, and that Metrics (Technical Preview) is ON.
-
Set the Logstash URL to point to your Logstash instance.
By default, the integration collects Logstash monitoring metrics fromhttps://localhost:9600. If that host and port number are not correct, update theLogstash URLsetting. If you configured Logstash to use encrypted communications and/or a username and password, you must access it using HTTPS. Expand the Advanced Settings options, and fill in the appropriate values for your Logstash instance.
View assets
edit- Go to Project settings → Integrations to see your Installed integrations.
- Select the Logstash integration, and then select Assets to access dashboards for the Logstash integration.
Monitor Logstash logs and metrics
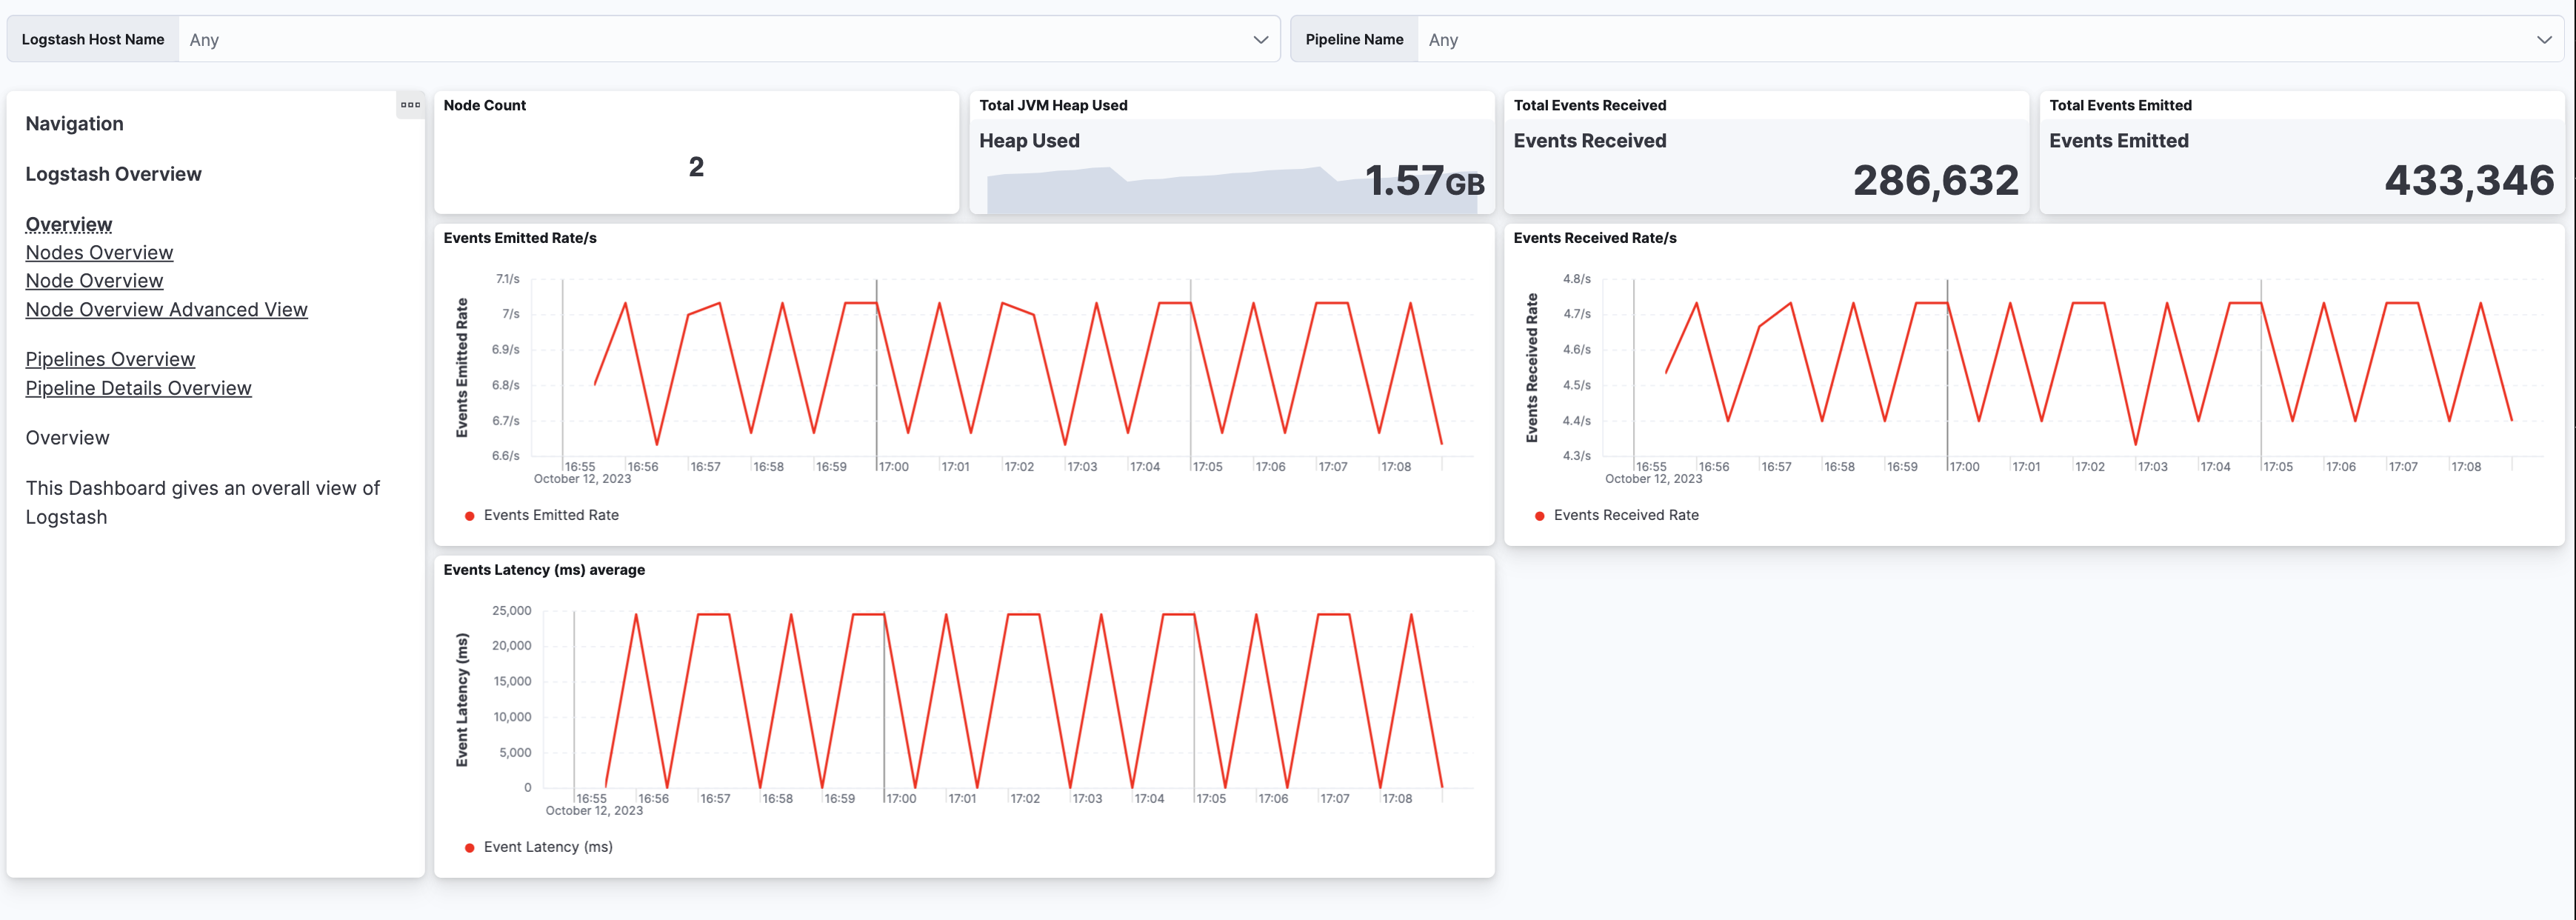
editFrom the list of assets, open the [Metrics Logstash] Logstash overview dashboard to view overall performance. Then follow the navigation panel to further drill down into Logstash performance.

You can hover over any visualization to adjust its settings, or click the Edit button to make changes to the dashboard. To learn more, refer to Dashboard and visualizations.