This documentation contains work-in-progress information for future Elastic Stack and Cloud releases. Use the version selector to view supported release docs. It also contains some Elastic Cloud serverless information. Check out our serverless docs for more details.
Create a dashboard
editCreate a dashboard
edit- Open the Dashboards page in Kibana.
-
Select Create dashboard to start with an empty dashboard.
When you create a dashboard, you are automatically in edit mode and can make changes to the dashboard.
-
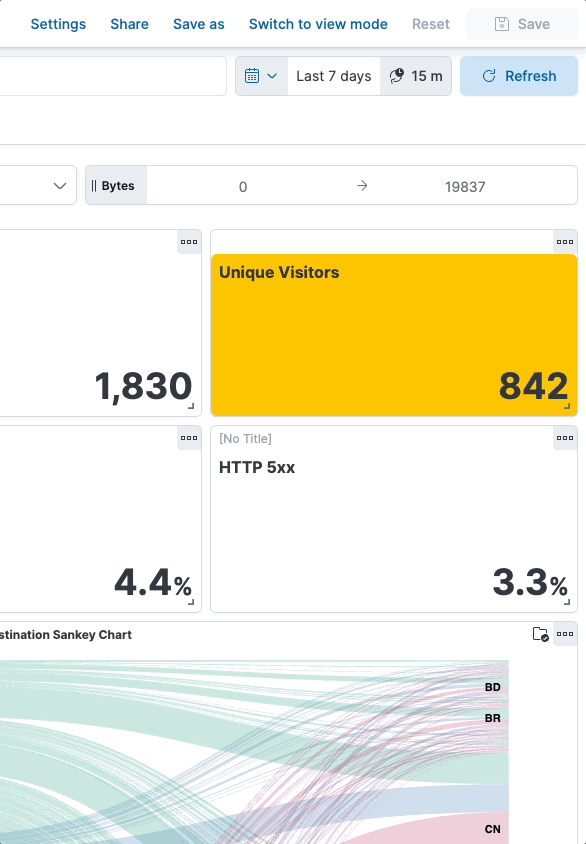
Add content to the dashboard. You have several options covered in more detail in the Visualizations section:
- Create visualization. This option is a shortcut to create a chart using Lens, the default visualization editor in Kibana.
- Add panel. Choose one of the available panels to add and configure content to your dashboard.
- Add from library. Select existing content that has already been configured and saved to the Visualize Library.
-
Controls. Add controls to help filter the content of your dashboard.

- Organize your dashboard by organizing the various panels.
-
Define the main settings of your dashboard from the Settings menu located in the toolbar.
- A meaningful title, description, and tags allow you to find the dashboard quickly later when browsing your list of dashboards or using the Kibana search bar.
-
Additional display options allow you unify the look and feel of the dashboard’s panels:
- Store time with dashboard — Saves the specified time filter.
- Use margins between panels — Adds a margin of space between each panel.
- Show panel titles — Displays the titles in the panel headers.
- Sync color palettes across panels — Applies the same color palette to all panels on the dashboard.
- Sync cursor across panels — When you hover your cursor over a time series chart or a heatmap, the cursor on all other related dashboard charts automatically appears.
- Sync tooltips across panels — When you hover your cursor over a Lens chart, the tooltips on all other related dashboard charts automatically appear.
-
Click Apply.
- Click Save to save the dashboard.