WARNING: Version 6.0 of Kibana has passed its EOL date.
This documentation is no longer being maintained and may be removed. If you are running this version, we strongly advise you to upgrade. For the latest information, see the current release documentation.
Profiling your Queries and Aggregations
edit
IMPORTANT: This documentation is no longer updated. Refer to Elastic's version policy and the latest documentation.
Profiling your Queries and Aggregations
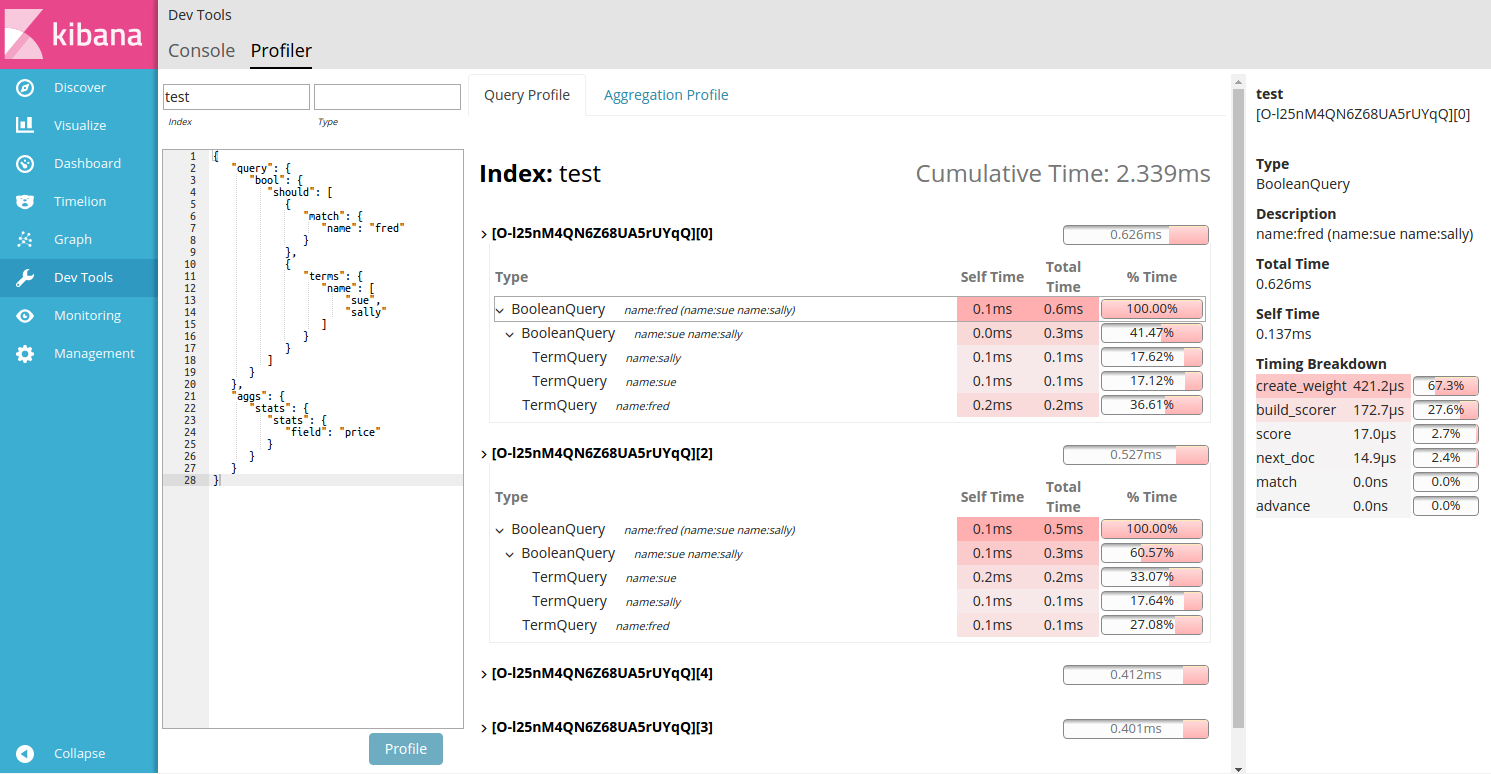
editElasticsearch has a powerful profiler API which can be used to inspect and analyze your search queries. The response, however, is a very large JSON blob which is difficult to analyze by hand.
X-Pack includes the Search Profiler tool which can transform this JSON output into a visualization that is easy to navigate, allowing you to diagnose and debug poorly performing queries much faster.