WARNING: Version 5.2 of Kibana has passed its EOL date.
This documentation is no longer being maintained and may be removed. If you are running this version, we strongly advise you to upgrade. For the latest information, see the current release documentation.
Creating Time Series Visualizations
editCreating Time Series Visualizations
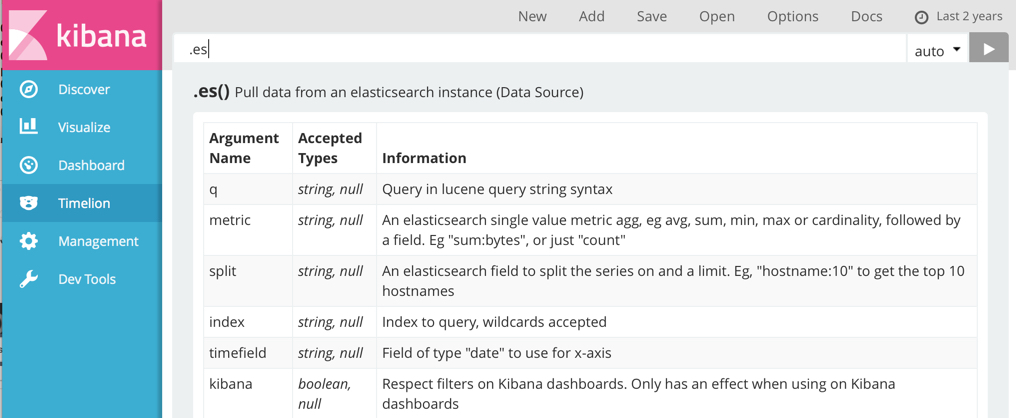
editTo start building time-series visualizations, click Timelion in the side navigation and run through the tutorial. Documentation for the Timelion expression language is built-in. Click Docs in the toolbar to view the available functions and access the tutorial. As you start to enter functions in the query bar, Timelion displays the available arguments:

To incorporate a Timelion visualization into a Kibana dashboard, save the Timelion expression as a Kibana dashboard panel. You can then add it to a dashboard like any other visualization.
You can also create time series visualizations right from the Visualize app—just select the Timeseries visualization type and enter a Timelion expression in the expression field.