Ingest logs from a Python application using Filebeat
Elastic Stack
This guide demonstrates how to ingest logs from a Python application and deliver them securely into an Elastic Cloud Hosted deployment. You’ll set up Filebeat to monitor a JSON-structured log file that has standard Elastic Common Schema (ECS) formatted fields, and you’ll then view real-time visualizations of the log events in Kibana as they occur. While Python is used for this example, this approach to monitoring log output is applicable across many client types. Check the list of available ECS logging plugins.
Time required: 1 hour
To complete these steps you need to have Python installed on your system as well as the Elastic Common Schema (ECS) logger for the Python logging library.
To install ecs-logging-python, run:
python -m pip install ecs-logging
- Get a free trial.
- Log into Elastic Cloud.
- Select Create deployment.
- Give your deployment a name. You can leave all other settings at their default values.
- Select Create deployment and save your Elastic deployment credentials. You need these credentials later on.
- When the deployment is ready, click Continue and a page of Setup guides is displayed. To continue to the deployment homepage click I’d like to do something else.
Prefer not to subscribe to yet another service? You can also get Elastic Cloud Hosted through AWS, Azure, and GCP marketplaces.
- Log into the Elastic Cloud Enterprise admin console.
- Select Create deployment.
- Give your deployment a name. You can leave all other settings at their default values.
- Select Create deployment and save your Elastic deployment credentials. You need these credentials later on.
- When the deployment is ready, click Continue and a page of Setup guides is displayed. To continue to the deployment homepage click I’d like to do something else.
When connecting to Elastic Cloud Hosted or Elastic Cloud Enterprise, you can use a Cloud ID to specify the connection details. Find your Cloud ID by going to the Kibana main menu and selecting Management > Integrations, and then selecting View deployment details.
To connect to, stream data to, and issue queries, you need to think about authentication. Two authentication mechanisms are supported, API key and basic authentication. Here, to get you started quickly, we’ll show you how to use basic authentication, but you can also generate API keys as shown later on. API keys are safer and preferred for production environments.
In this step, you’ll create a Python script that generates logs in JSON format, using Python’s standard logging module.
In a local directory, create a new file elvis.py and save it with these contents:
#!/usr/bin/python

import logging
import ecs_logging
import time
from random import randint

#logger = logging.getLogger(__name__)
logger = logging.getLogger("app")
logger.setLevel(logging.DEBUG)
handler = logging.FileHandler('elvis.json')
handler.setFormatter(ecs_logging.StdlibFormatter())
logger.addHandler(handler)

print("Generating log entries...")

messages = [
    "Elvis has left the building.",#
    "Elvis has left the oven on.",
    "Elvis has two left feet.",
    "Elvis was left out in the cold.",
    "Elvis was left holding the baby.",
    "Elvis left the cake out in the rain.",
    "Elvis came out of left field.",
    "Elvis exited stage left.",
    "Elvis took a left turn.",
    "Elvis left no stone unturned.",
    "Elvis picked up where he left off.",
    "Elvis's train has left the station."
    ]

while True:
    random1 = randint(0,15)
    random2 = randint(1,10)
    if random1 > 11:
        random1 = 0
    if(random1<=4):
        logger.info(messages[random1], extra={"http.request.body.content": messages[random1]})
    elif(random1>=5 and random1<=8):
        logger.warning(messages[random1], extra={"http.request.body.content": messages[random1]})
    elif(random1>=9 and random1<=10):
        logger.error(messages[random1], extra={"http.request.body.content": messages[random1]})
    else:
        logger.critical(messages[random1], extra={"http.request.body.content": messages[random1]})
    time.sleep(random2)
This Python script randomly generates one of twelve log messages, continuously, at a random interval of between 1 and 10 seconds. The log messages are written to file
elvis.json, each with a timestamp, a log level of info, warning, error, or critical, and other data. Just to add some variance to the log data, the info message Elvis has left the building is set to be the most probable log event.For simplicity, there is just one log file and it is written to the local directory where
elvis.pyis located. In a production environment you may have multiple log files, associated with different modules and loggers, and likely stored in/var/logor similar. To learn more about configuring logging in Python, check Logging facility for Python.Having your logs written in a JSON format with ECS fields allows for easy parsing and analysis, and for standardization with other applications. A standard, easily parsible format becomes increasingly important as the volume and type of data captured in your logs expands over time.
Together with the standard fields included for each log entry is an extra http.request.body.content field. This extra field is there just to give you some additional, interesting data to work with, and also to demonstrate how you can add optional fields to your log data. Check the ECS Field Reference for the full list of available fields.
Let’s give the Python script a test run. Open a terminal instance in the location where you saved elvis.py and run the following:
python elvis.pyAfter the script has run for about 15 seconds, enter CTRL + C to stop it. Have a look at the newly generated elvis.json. It should contain one or more entries like this one:
{"@timestamp":"2021-06-16T02:19:34.687Z","log.level":"info","message":"Elvis has left the building.","ecs":{"version":"1.6.0"},"http":{"request":{"body":{"content":"Elvis has left the building."}}},"log":{"logger":"app","origin":{"file":{"line":39,"name":"elvis.py"},"function":"<module>"},"original":"Elvis has left the building."},"process":{"name":"MainProcess","pid":3044,"thread":{"id":4444857792,"name":"MainThread"}}}After confirming that elvis.py runs as expected, you can delete elvis.json.
Filebeat offers a straightforward, easy to configure way to monitor your Python log files and port the log data into your deployment.
Get Filebeat
Download Filebeat and unpack it on the local server from which you want to collect data.
Configure Filebeat to access Elastic Cloud Hosted or Elastic Cloud Enterprise
In <localpath>/filebeat-<version>/ (where <localpath> is the directory where Filebeat is installed and <version> is the Filebeat version number), open the filebeat.yml configuration file for editing.
# =============================== Elastic Cloud ================================

# These settings simplify using Filebeat with the Elastic Cloud (https://cloud.elastic.co/).

# The cloud.id setting overwrites the `output.elasticsearch.hosts` and
# `setup.kibana.host` options.
# You can find the `cloud.id` in the Elastic Cloud web UI.
cloud.id: my-deployment:long-hash

# The cloud.auth setting overwrites the `output.elasticsearch.username` and
# `output.elasticsearch.password` settings. The format is `<user>:<pass>`.
cloud.auth: elastic:password
- Uncomment the
cloud.idline and add the deployment’s Cloud ID. You can include or omit the <deploymentname>: prefix at the beginning of the Cloud ID. Both versions work fine. Find your Cloud ID by going to the Kibana main menu and selecting Management > Integrations, and then selecting View deployment details. - Uncomment the
cloud.authline and add the username and password for your deployment that you recorded when you created your deployment. The format is <username>:<password>, for example elastic:57ugj782kvkwmSKg8uVe.
Configure Filebeat inputs
Filebeat has several ways to collect logs. For this example, you’ll configure log collection manually.
In the filebeat.inputs section of filebeat.yml, set enabled: to true, and set paths: to the location of your log file or files. In this example, set the same directory where you saved elvis.py:
filebeat.inputs:

# Each - is an input. Most options can be set at the input level, so
# you can use different inputs for various configurations.
# Below are the input specific configurations.

- type: log

  # Change to true to enable this input configuration.
  enabled: true

  # Paths that should be crawled and fetched. Glob based paths.
  paths:
    - /path/to/log/files/*.json
You can specify a wildcard (*) character to indicate that all log files in the specified directory should be read. You can also use a wildcard to read logs from multiple directories. For example /var/log/*/*.log.
Add the JSON input options
Filebeat’s input configuration options include several settings for decoding JSON messages. Log files are decoded line by line, so it’s important that they contain one JSON object per line.
For this example, Filebeat uses the following four decoding options.
json.keys_under_root: true
json.overwrite_keys: true
json.add_error_key: true
json.expand_keys: true
To learn more about these settings, check JSON input configuration options and Decode JSON fields in the Filebeat Reference.
Append the four JSON decoding options to the Filebeat inputs section of filebeat.yml, so that the section now looks like this:
# ============================== Filebeat inputs ===============================

filebeat.inputs:

# Each - is an input. Most options can be set at the input level, so
# you can use different inputs for various configurations.
# Below are the input specific configurations.

- type: log

  # Change to true to enable this input configuration.
  enabled: true

  # Paths that should be crawled and fetched. Glob based paths.
  paths:
    - /path/to/log/files/*.json
  json.keys_under_root: true
  json.overwrite_keys: true
  json.add_error_key: true
  json.expand_keys: true
Finish setting up Filebeat
Filebeat comes with predefined assets for parsing, indexing, and visualizing your data. To load these assets, run the following from the Filebeat installation directory:
./filebeat setup -e
Depending on variables including the installation location, environment, and local permissions, you might need to change the ownership of filebeat.yml. You can also try running the command as root: sudo ./filebeat setup -e or you can disable strict permission checks by running the command with the --strict.perms=false option.
The setup process takes a couple of minutes. If everything goes successfully you should get a confirmation message:
Loaded Ingest pipelines
The Filebeat data view (formerly index pattern) is now available in Elasticsearch. To verify:
Beginning with Elastic Stack version 8.0, Kibana index patterns have been renamed to data views. To learn more, check the Kibana What’s new in 8.0 page.
- Login to Kibana.
- Open the Kibana main menu and select Management > Kibana > Data views.
- In the search bar, search for filebeat. You should get filebeat-* in the search results.
Optional: Use an API key to authenticate
For additional security, instead of using basic authentication you can generate an Elasticsearch API key through the through the Elastic Cloud Hosted or Elastic Cloud Enterprise console, and then configure Filebeat to use the new key to connect securely to your deployment.
For Elastic Cloud Hosted, log into Elastic Cloud Console, or for Elastic Cloud Enterprise, log into the admin console.
Select the deployment name and go to ☰ > Management > Dev Tools.
Enter the following request:
POST /_security/api_key
{
 "name": "filebeat-api-key",
 "role_descriptors": {
   "logstash_read_write": {
     "cluster": ["manage_index_templates", "monitor"],
     "index": [
       {
         "names": ["filebeat-*"],
         "privileges": ["create_index", "write", "read", "manage"]
       }
     ]
   }
 }
}
This creates an API key with the cluster
monitorprivilege which gives read-only access for determining the cluster state, andmanage_index_templateswhich allows all operations on index templates. Some additional privileges also allowcreate_index,write, andmanageoperations for the specified index. The indexmanageprivilege is added to enable index refreshes.Click ▶. The output should be similar to the following:
{
  "api_key": "tV1dnfF-GHI59ykgv4N0U3",
  "id": "2TBR42gBabmINotmvZjv",
  "name": "filebeat-api-key"
}
Add your API key information to the Elasticsearch Output section of
filebeat.yml, just below output.elasticsearch:. Use the format<id>:<api_key>. If your results are as shown in this example, enter2TBR42gBabmINotmvZjv:tV1dnfF-GHI59ykgv4N0U3.Add a pound (
#) sign to comment out the cloud.auth: elastic:<password> line, since Filebeat will use the API key instead of the deployment username and password to authenticate.# =============================== Elastic Cloud ================================ # These settings simplify using Filebeat with the Elastic Cloud (https://cloud.elastic.co/). # The cloud.id setting overwrites the `output.elasticsearch.hosts` and # `setup.kibana.host` options. # You can find the `cloud.id` in the Elastic Cloud web UI. cloud.id: my-deployment:yTMtd5VzdKEuP2NwPbNsb3VkLtKzLmldJDcyMzUyNjBhZGP7MjQ4OTZiNTIxZTQyOPY2C2NeOGQwJGQ2YWQ4M5FhNjIyYjQ9ODZhYWNjKDdlX2Yz4ELhRYJ7 # The cloud.auth setting overwrites the `output.elasticsearch.username` and # `output.elasticsearch.password` settings. The format is `<user>:<pass>`. #cloud.auth: elastic:591KhtuAgTP46by9C4EmhGuk # ================================== Outputs =================================== # Configure what output to use when sending the data collected by the beat. # ---------------------------- Elasticsearch Output ---------------------------- output.elasticsearch: # Array of hosts to connect to. api_key: "2TBR42gBabmINotmvZjv:tV1dnfF-GHI59ykgv4N0U3"
It’s time to send some log data into EElasticsearch!
Launch Filebeat and elvis.py
Launch Filebeat by running the following from the Filebeat installation directory:
./filebeat -e -c filebeat.yml
In this command:
- The -e flag sends output to the standard error instead of the configured log output.
- The -c flag specifies the path to the Filebeat config file.
Just in case the command doesn’t work as expected, check the Filebeat quick start for the detailed command syntax for your operating system. You can also try running the command as root: sudo ./filebeat -e -c filebeat.yml.
Filebeat should now be running and monitoring the contents of elvis.json, which actually doesn’t exist yet. So, let’s create it. Open a new terminal instance and run the elvis.py Python script:
python elvis.py
Let the script run for a few minutes and maybe brew up a quick coffee or tea ☕ . After that, make sure that the elvis.json file is generated as expected and is populated with several log entries.
Verify the log entries
The next step is to confirm that the log data has successfully found it’s way into your deployment.
- Login to Kibana.
- Open the Kibana main menu and select Management > Kibana > Data views.
- In the search bar, search for filebeat_. You should get _filebeat-_ in the search results.
- Select filebeat-*.
The filebeat data view shows a list of fields and their details.
Now it’s time to create visualizations based off of the Python application log data.
Open the Kibana main menu and select Dashboard, then Create dashboard.
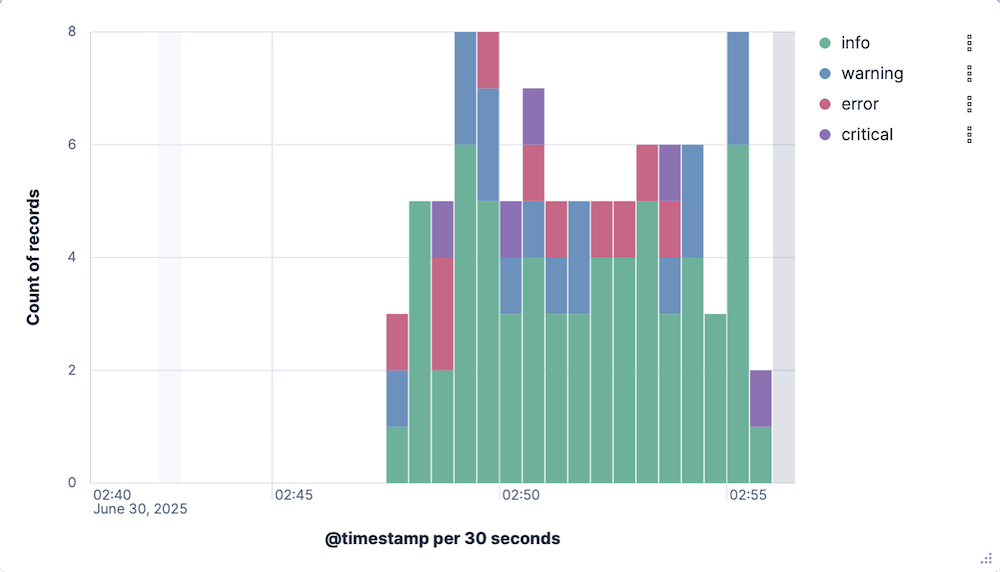
Select Create visualization. The Lens visualization editor opens.
In the data view dropdown box, select _filebeat-_, if it isn’t already selected.
In the Visualization type dropdown, select Bar vertical stacked, if it isn’t already selected.
Check that the time filter is set to Last 15 minutes.
From the Available fields list, drag and drop the @timestamp field onto the visualization builder.
Drag and drop the log.level field onto the visualization builder.
In the chart settings area, under Break down by, select Top values of log.level and set Number of values to 4. Since there are four log severity levels, this parameter sets all of them to appear in the chart legend.
Select Refresh. A stacked bar chart now shows the relative frequency of each of the four log severity levels over time.

Select Save and return to add this visualization to your dashboard.
Let’s create a second visualization.
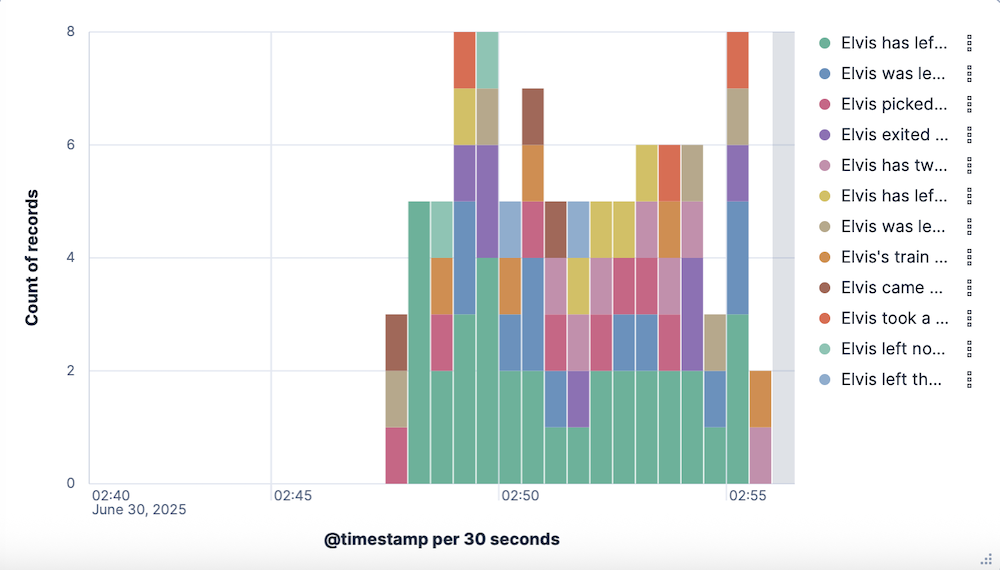
Select Create visualization.
Again, make sure that Visualization type dropdown is set to Bar vertical stacked.
From the Available fields list, drag and drop the @timestamp field onto the visualization builder.
Drag and drop the http.request.body.content field onto the visualization builder.
In the chart settings area, under Break down by, select Top values of http.request.body.content and set Number of values to 12. Since there are twelve different log messages, this parameter sets all of them to appear in the chart legend.
Select Refresh. A stacked bar chart now shows the relative frequency of each of the log messages over time.

Select Save and return to add this visualization to your dashboard.
And now for the final visualization.
Select Create visualization.
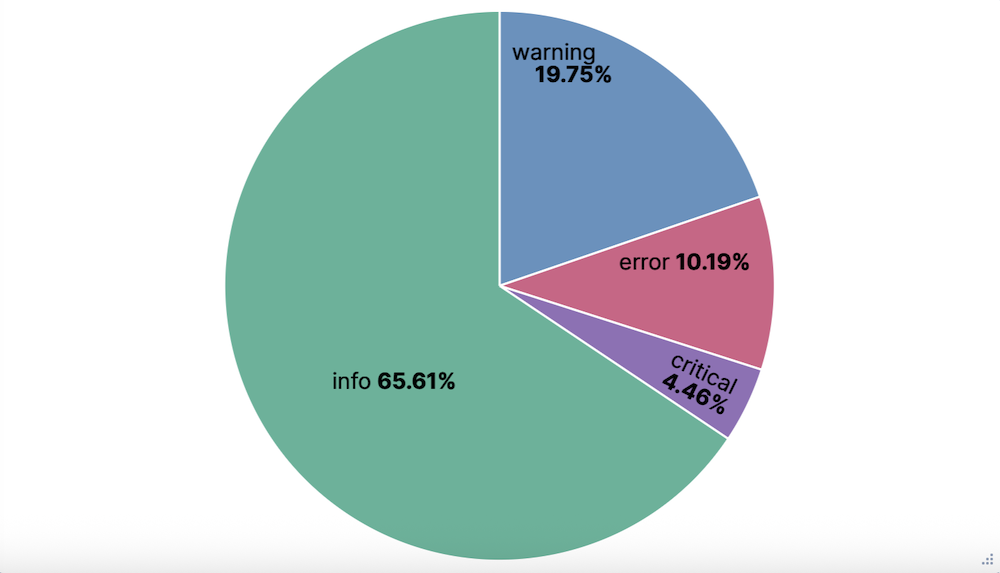
In the Visualization type dropdown dropdown, select Donut.
From the list of available fields, drag and drop the log.level field onto the visualization builder. A donut chart appears.

Select Save and return to add this visualization to your dashboard.
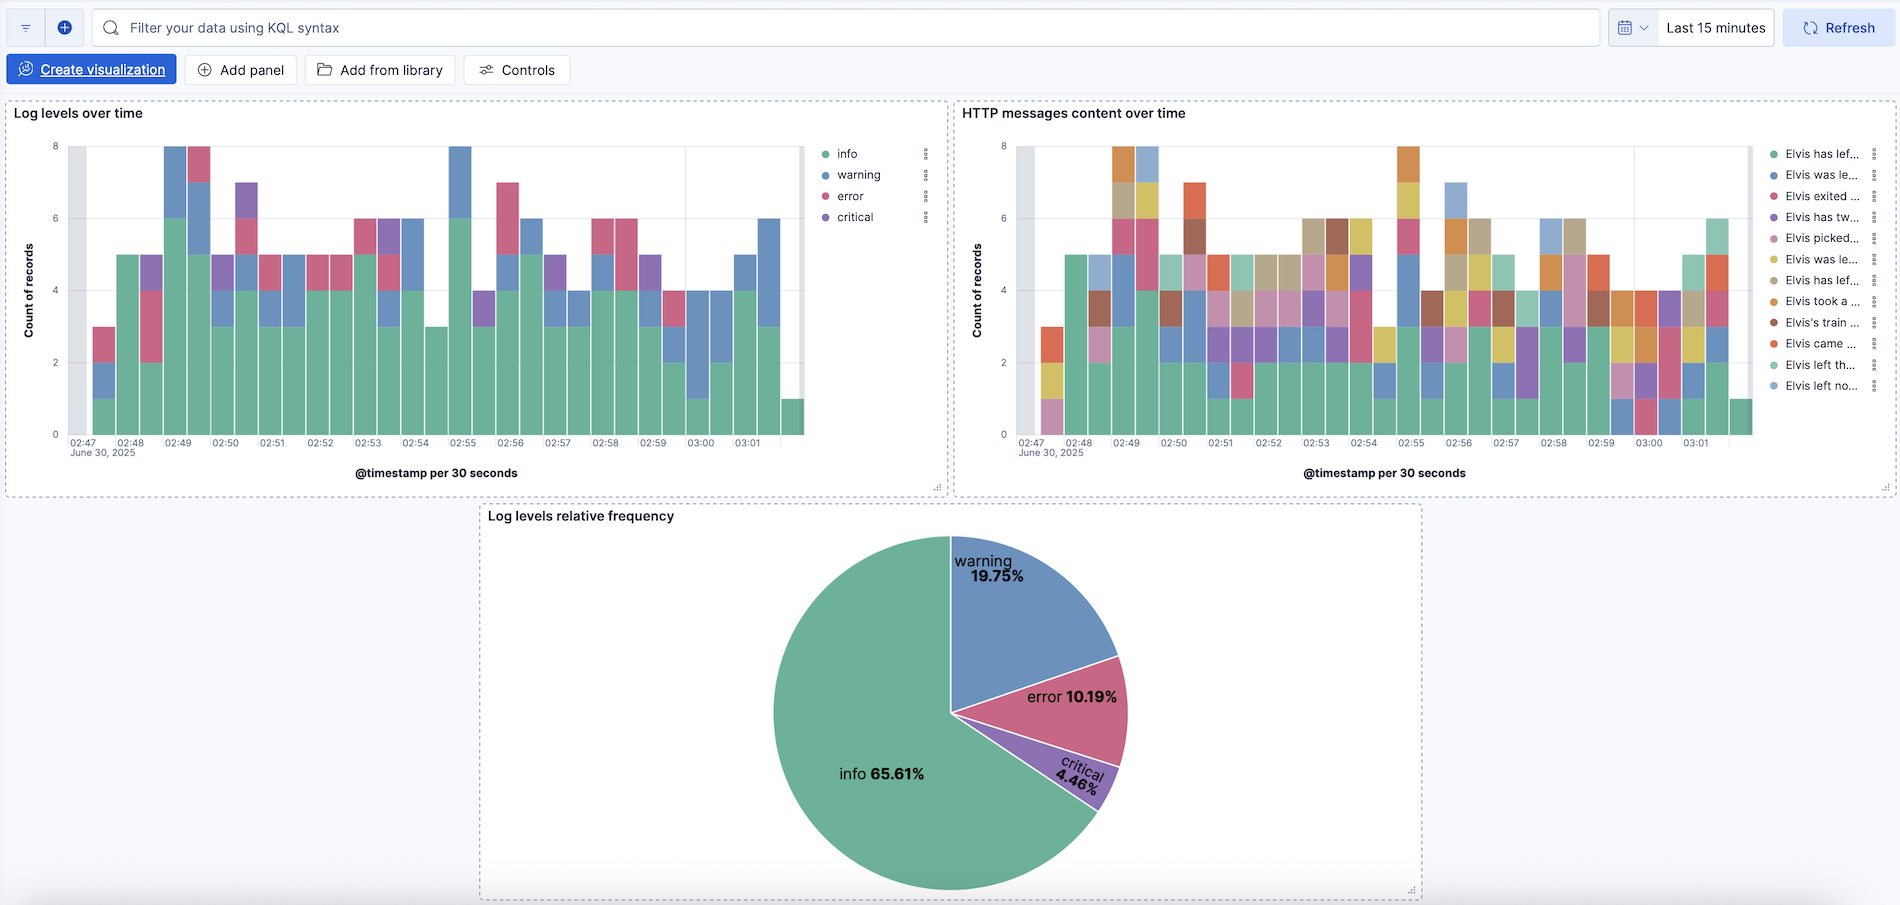
Select Save and add a title to save your new dashboard.
You now have a Kibana dashboard with three visualizations: a stacked bar chart showing the frequency of each log severity level over time, another stacked bar chart showing the frequency of various message strings over time (from the added http.request.body.content parameter), and a donut chart showing the relative frequency of each log severity type.
You can add titles to the visualizations, resize and position them as you like, and then save your changes.
View log data updates in real time
Select Refresh on the Kibana dashboard. Since elvis.py continues to run and generate log data, your Kibana visualizations update with each refresh.

As your final step, remember to stop Filebeat and the Python script. Enter CTRL + C in both your Filebeat terminal and in your
elvis.pyterminal.
You now know how to monitor log files from a Python application, deliver the log event data securely into an Elastic Cloud Hosted or Elastic Cloud Enterprise deployment, and then visualize the results in Kibana in real time. Consult the Filebeat documentation to learn more about the ingestion and processing options available for your data. You can also explore our documentation to learn all about all about ingesting data.