- Metricbeat Reference: other versions:
- Metricbeat overview
- Quick start: installation and configuration
- Set up and run
- Upgrade Metricbeat
- How Metricbeat works
- Configure
- Modules
- General settings
- Project paths
- Config file loading
- Output
- Kerberos
- SSL
- Index lifecycle management (ILM)
- Elasticsearch index template
- Kibana endpoint
- Kibana dashboards
- Processors
- Define processors
- add_cloud_metadata
- add_cloudfoundry_metadata
- add_docker_metadata
- add_fields
- add_host_metadata
- add_id
- add_kubernetes_metadata
- add_labels
- add_locale
- add_network_direction
- add_nomad_metadata
- add_observer_metadata
- add_process_metadata
- add_tags
- community_id
- convert
- copy_fields
- decode_base64_field
- decode_json_fields
- decode_xml
- decode_xml_wineventlog
- decompress_gzip_field
- detect_mime_type
- dissect
- dns
- drop_event
- drop_fields
- extract_array
- fingerprint
- include_fields
- rate_limit
- registered_domain
- rename
- replace
- script
- syslog
- translate_sid
- truncate_fields
- urldecode
- Autodiscover
- Internal queue
- Logging
- HTTP endpoint
- Regular expression support
- Instrumentation
- metricbeat.reference.yml
- How to guides
- Modules
- ActiveMQ module
- Aerospike module
- Airflow module
- Apache module
- AWS module
- AWS billing metricset
- AWS cloudwatch metricset
- AWS dynamodb metricset
- AWS ebs metricset
- AWS ec2 metricset
- AWS elb metricset
- AWS kinesis metricset
- AWS lambda metricset
- AWS natgateway metricset
- AWS rds metricset
- AWS s3_daily_storage metricset
- AWS s3_request metricset
- AWS sns metricset
- AWS sqs metricset
- AWS transitgateway metricset
- AWS usage metricset
- AWS vpn metricset
- AWS Fargate module
- Azure module
- Azure app_insights metricset
- Azure app_state metricset
- Azure billing metricset
- Azure compute_vm metricset
- Azure compute_vm_scaleset metricset
- Azure container_instance metricset
- Azure container_registry metricset
- Azure container_service metricset
- Azure database_account metricset
- Azure monitor metricset
- Azure storage metricset
- Beat module
- Ceph module
- Ceph cluster_disk metricset
- Ceph cluster_health metricset
- Ceph cluster_status metricset
- Ceph mgr_cluster_disk metricset
- Ceph mgr_cluster_health metricset
- Ceph mgr_osd_perf metricset
- Ceph mgr_osd_pool_stats metricset
- Ceph mgr_osd_tree metricset
- Ceph mgr_pool_disk metricset
- Ceph monitor_health metricset
- Ceph osd_df metricset
- Ceph osd_tree metricset
- Ceph pool_disk metricset
- Cloudfoundry module
- CockroachDB module
- Consul module
- Containerd module
- Coredns module
- Couchbase module
- CouchDB module
- Docker module
- Dropwizard module
- Elasticsearch module
- Elasticsearch ccr metricset
- Elasticsearch cluster_stats metricset
- Elasticsearch enrich metricset
- Elasticsearch index metricset
- Elasticsearch index_recovery metricset
- Elasticsearch index_summary metricset
- Elasticsearch ml_job metricset
- Elasticsearch node metricset
- Elasticsearch node_stats metricset
- Elasticsearch pending_tasks metricset
- Elasticsearch shard metricset
- Enterprise Search module
- Envoyproxy module
- Etcd module
- Google Cloud Platform module
- Google Cloud Platform billing metricset
- Google Cloud Platform compute metricset
- Google Cloud Platform dataproc metricset
- Google Cloud Platform firestore metricset
- Google Cloud Platform gke metricset
- Google Cloud Platform loadbalancing metricset
- Google Cloud Platform metrics metricset
- Google Cloud Platform pubsub metricset
- Google Cloud Platform storage metricset
- Golang module
- Graphite module
- HAProxy module
- HTTP module
- IBM MQ module
- IIS module
- Istio module
- Jolokia module
- Kafka module
- Kibana module
- Kubernetes module
- Kubernetes apiserver metricset
- Kubernetes container metricset
- Kubernetes controllermanager metricset
- Kubernetes event metricset
- Kubernetes node metricset
- Kubernetes pod metricset
- Kubernetes proxy metricset
- Kubernetes scheduler metricset
- Kubernetes state_container metricset
- Kubernetes state_cronjob metricset
- Kubernetes state_daemonset metricset
- Kubernetes state_deployment metricset
- Kubernetes state_job metricset
- Kubernetes state_node metricset
- Kubernetes state_persistentvolumeclaim metricset
- Kubernetes state_pod metricset
- Kubernetes state_replicaset metricset
- Kubernetes state_resourcequota metricset
- Kubernetes state_service metricset
- Kubernetes state_statefulset metricset
- Kubernetes state_storageclass metricset
- Kubernetes system metricset
- Kubernetes volume metricset
- KVM module
- Linux module
- Logstash module
- Memcached module
- MongoDB module
- MSSQL module
- Munin module
- MySQL module
- NATS module
- Nginx module
- Openmetrics module
- Oracle module
- PHP_FPM module
- PostgreSQL module
- Prometheus module
- RabbitMQ module
- Redis module
- Redis Enterprise module
- SQL module
- Stan module
- Statsd module
- SyncGateway module
- System module
- System core metricset
- System cpu metricset
- System diskio metricset
- System entropy metricset
- System filesystem metricset
- System fsstat metricset
- System load metricset
- System memory metricset
- System network metricset
- System network_summary metricset
- System process metricset
- System process_summary metricset
- System raid metricset
- System service metricset
- System socket metricset
- System socket_summary metricset
- System uptime metricset
- System users metricset
- Tomcat module
- Traefik module
- uWSGI module
- vSphere module
- Windows module
- ZooKeeper module
- Exported fields
- ActiveMQ fields
- Aerospike fields
- Airflow fields
- Apache fields
- AWS fields
- AWS Fargate fields
- Azure fields
- Beat fields
- Beat fields
- Ceph fields
- Cloud provider metadata fields
- Cloudfoundry fields
- CockroachDB fields
- Common fields
- Consul fields
- Containerd fields
- Coredns fields
- Couchbase fields
- CouchDB fields
- Docker fields
- Docker fields
- Dropwizard fields
- ECS fields
- Elasticsearch fields
- Enterprise Search fields
- Envoyproxy fields
- Etcd fields
- Google Cloud Platform fields
- Golang fields
- Graphite fields
- HAProxy fields
- Host fields
- HTTP fields
- IBM MQ fields
- IIS fields
- Istio fields
- Jolokia fields
- Jolokia Discovery autodiscover provider fields
- Kafka fields
- Kibana fields
- Kubernetes fields
- Kubernetes fields
- KVM fields
- Linux fields
- Logstash fields
- Memcached fields
- MongoDB fields
- MSSQL fields
- Munin fields
- MySQL fields
- NATS fields
- Nginx fields
- Openmetrics fields
- Oracle fields
- PHP_FPM fields
- PostgreSQL fields
- Process fields
- Prometheus fields
- Prometheus typed metrics fields
- RabbitMQ fields
- Redis fields
- Redis Enterprise fields
- SQL fields
- Stan fields
- Statsd fields
- SyncGateway fields
- System fields
- Tomcat fields
- Traefik fields
- uWSGI fields
- vSphere fields
- Windows fields
- ZooKeeper fields
- Monitor
- Secure
- Troubleshoot
- Get help
- Debug
- Common problems
- "open /compat/linux/proc: no such file or directory" error on FreeBSD
- Metricbeat collects system metrics for interfaces you didn’t configure
- Metricbeat uses too much bandwidth
- Error loading config file
- Found unexpected or unknown characters
- Logstash connection doesn’t work
- Publishing to Logstash fails with "connection reset by peer" message
- @metadata is missing in Logstash
- Not sure whether to use Logstash or Beats
- SSL client fails to connect to Logstash
- Monitoring UI shows fewer Beats than expected
- Dashboard could not locate the index-pattern
- High RSS memory usage due to MADV settings
- Contribute to Beats
AWS ec2 metricset
editAWS ec2 metricset
editThe ec2 metricset of aws module allows you to monitor your AWS EC2 instances,
including cpu
, network
, disk
and status
. ec2
metricset fetches a set of values from
Cloudwatch AWS EC2 Metrics.
We fetch the following data:
- cpu.total.pct: The percentage of allocated EC2 compute units that are currently in use on the instance.
- cpu.credit_usage: The number of CPU credits spent by the instance for CPU utilization.
- cpu.credit_balance: The number of earned CPU credits that an instance has accrued since it was launched or started.
- cpu.surplus_credit_balance: The number of surplus credits that have been spent by an unlimited instance when its CPUCreditBalance value is zero.
- cpu.surplus_credits_charged: The number of spent surplus credits that are not paid down by earned CPU credits, and which thus incur an additional charge.
- network.in.packets: The number of packets received on all network interfaces by the instance.
- network.out.packets: The number of packets sent out on all network interfaces by the instance.
- network.in.bytes: The number of bytes received on all network interfaces by the instance.
- network.out.bytes: The number of bytes sent out on all network interfaces by the instance.
- diskio.read.bytes: Bytes read from all instance store volumes available to the instance.
- diskio.write.bytes: Bytes written to all instance store volumes available to the instance.
- diskio.read.ops: Completed read operations from all instance store volumes available to the instance in a specified period of time.
- diskio.write.ops: Completed write operations to all instance store volumes available to the instance in a specified period of time.
- status.check_failed: Reports whether the instance has passed both the instance status check and the system status check in the last minute.
- status.check_failed_system: Reports whether the instance has passed the system status check in the last minute.
- status.check_failed_instance: Reports whether the instance has passed the instance status check in the last minute.
- instance.core.count: The number of CPU cores for the instance.
- instance.image.id: The ID of the image used to launch the instance.
- instance.monitoring.state: Indicates whether detailed monitoring is enabled.
- instance.private.dns_name: The private DNS name of the network interface.
- instance.private.ip: The private IPv4 address associated with the network interface.
- instance.public.dns_name: The public DNS name of the instance.
- instance.public.ip: The address of the Elastic IP address (IPv4) bound to the network interface.
- instance.state.code: The state of the instance, as a 16-bit unsigned integer.
- instance.threads_per_core: The state of the instance (pending | running | shutting-down | terminated | stopping | stopped).
AWS Permissions
editSome specific AWS permissions are required for IAM user to collect AWS EC2 metrics.
ec2:DescribeInstances ec2:DescribeRegions cloudwatch:GetMetricData cloudwatch:ListMetrics sts:GetCallerIdentity iam:ListAccountAliases
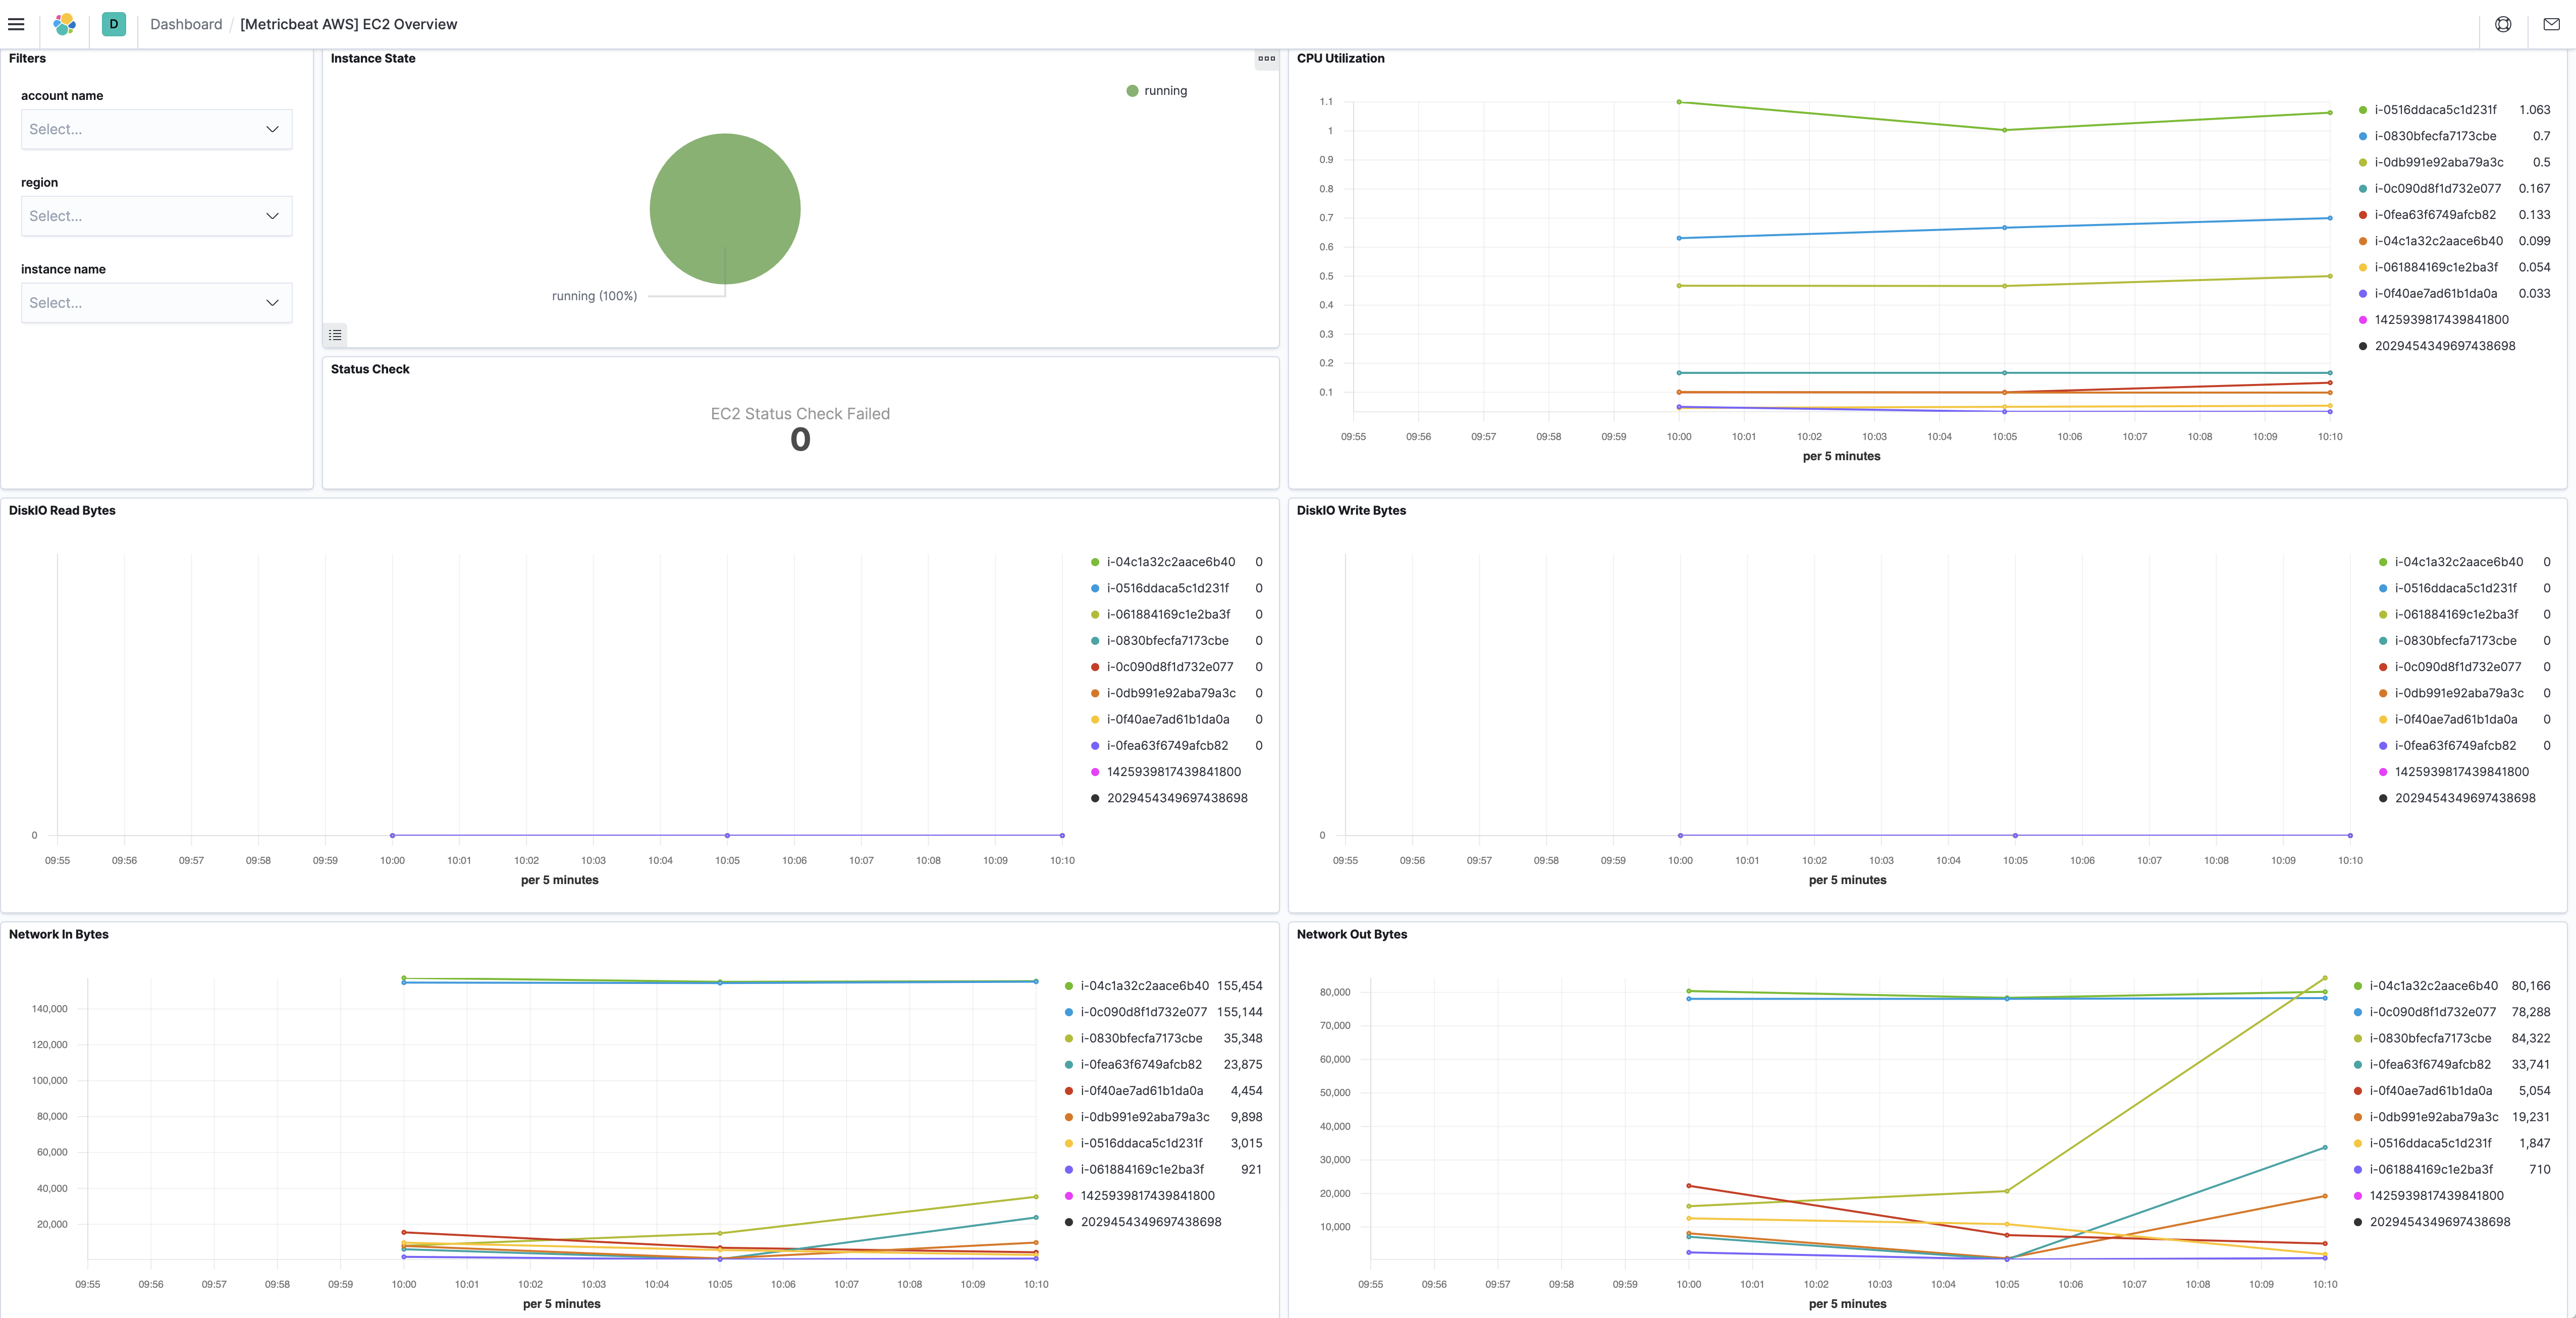
Dashboard
editThe aws ec2 metricset comes with a predefined dashboard. For example:

Configuration example
edit- module: aws period: 300s metricsets: - ec2 access_key_id: '<access_key_id>' secret_access_key: '<secret_access_key>' session_token: '<session_token>' tags_filter: - key: "Organization" value: ["Engineering", "Product"]
tags_filter
can be specified to only collect metrics with certain tag keys/values.
For example, with the configuration example above, ec2 metricset will only collect
metrics from EC2 instances that have tag key equals "Organization" and tag value
equals to "Engineering" or "Product".
This is a default metricset. If the host module is unconfigured, this metricset is enabled by default.
For a description of each field in the metricset, see the exported fields section.
Here is an example document generated by this metricset:
{ "@timestamp": "2017-10-12T08:05:34.853Z", "aws": { "cloudwatch": { "namespace": "AWS/EC2" }, "dimensions": { "InstanceId": "i-05b6228ff8d8c5d49" }, "ec2": { "cpu": { "credit_balance": 144, "credit_usage": 0.007318, "surplus_credit_balance": 0, "surplus_credits_charged": 0 }, "diskio": { "read": { "bytes_per_sec": 0, "count_per_sec": 0 }, "write": { "bytes_per_sec": 0, "count_per_sec": 0 } }, "instance": { "core": { "count": 1 }, "image": { "id": "ami-058b1b7fe545997ae" }, "monitoring": { "state": "disabled" }, "private": { "dns_name": "ip-172-31-31-247.eu-west-1.compute.internal", "ip": "172.31.31.247" }, "public": { "dns_name": "ec2-54-194-39-129.eu-west-1.compute.amazonaws.com", "ip": "54.194.39.129" }, "state": { "code": 16, "name": "running" }, "threads_per_core": 1 }, "network": { "in": { "bytes_per_sec": 18.343333333333334, "packets_per_sec": 0.15666666666666668 }, "out": { "bytes_per_sec": 15.326666666666666, "packets_per_sec": 0.16 } }, "status": { "check_failed": 0, "check_failed_instance": 0, "check_failed_system": 0 } } }, "cloud": { "account": { "id": "428152502467", "name": "elastic-beats" }, "availability_zone": "eu-west-1a", "instance": { "id": "i-05b6228ff8d8c5d49" }, "machine": { "type": "t2.micro" }, "provider": "aws", "region": "eu-west-1" }, "event": { "dataset": "aws.ec2", "duration": 115000, "module": "aws" }, "host": { "cpu": { "usage": 0.1005649717511616 }, "disk": { "read": { "bytes": 0 }, "write": { "bytes": 0 } }, "id": "i-05b6228ff8d8c5d49", "name": "i-05b6228ff8d8c5d49", "network": { "egress": { "bytes": 4598, "packets": 48 }, "ingress": { "bytes": 5503, "packets": 47 } } }, "metricset": { "name": "ec2", "period": 10000 }, "service": { "type": "aws" } }