aws elb metricset
editaws elb metricset
editThis functionality is in beta and is subject to change. The design and code is less mature than official GA features and is being provided as-is with no warranties. Beta features are not subject to the support SLA of official GA features.
Elastic Load Balancing publishes data points to Amazon CloudWatch for your load
balancers and your back-end instances. This aws elb metricset collects these
Cloudwatch metrics for monitoring purposes.
AWS Permissions
editSome specific AWS permissions are required for IAM user to collect AWS ELB metrics.
ec2:DescribeRegions
cloudwatch:GetMetricData
cloudwatch:ListMetrics
tag:getResources
sts:GetCallerIdentity
iam:ListAccountAliases
Dashboard
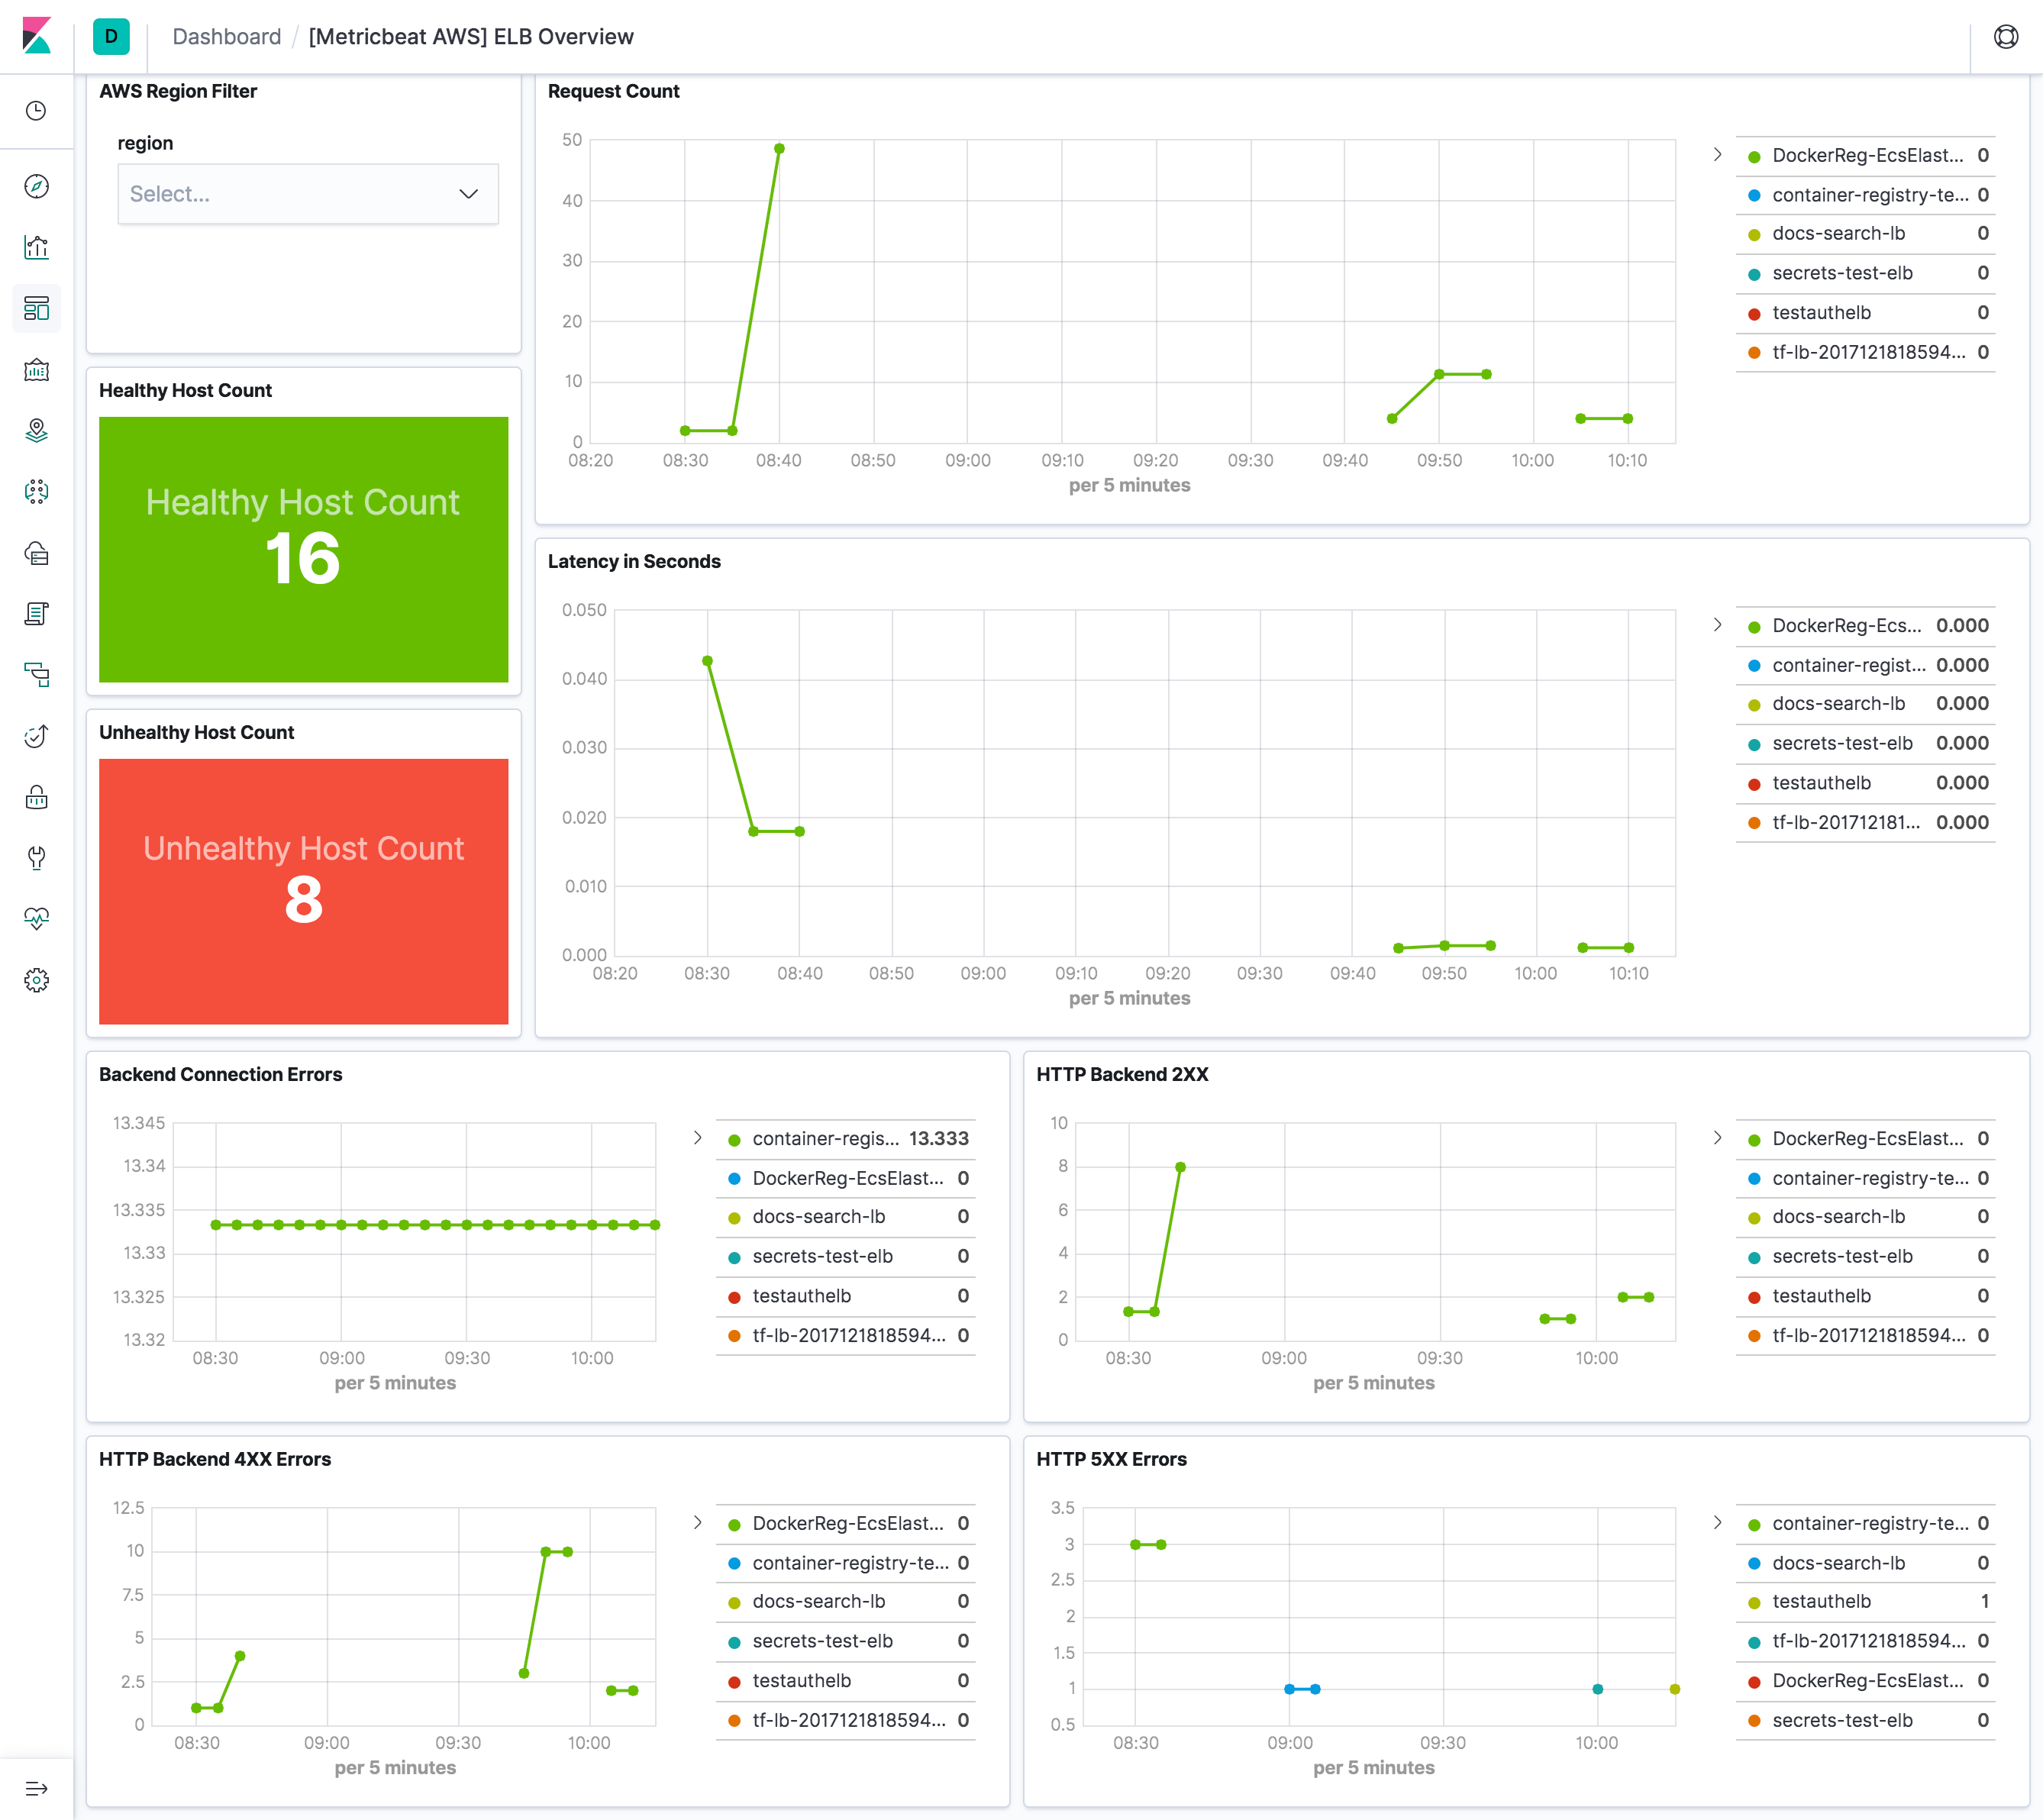
editThe aws elb metricset comes with a predefined dashboard. For example:
Configuration example
edit- module: aws
period: 300s
metricsets:
- elb
access_key_id: '${AWS_ACCESS_KEY_ID:""}'
secret_access_key: '${AWS_SECRET_ACCESS_KEY:""}'
session_token: '${AWS_SESSION_TOKEN:""}'
default_region: '${AWS_REGION:us-west-1}'
# This module uses the aws cloudwatch metricset, all
# the options for this metricset are also available here.
Metrics
editElastic Load Balancing publishes data points to Amazon CloudWatch for your load balancers and back-end instances. Please see more details for each metric in elb-cloudwatch-metric.
Metric Name |
Statistic Method |
BackendConnectionErrors |
Sum |
HealthyHostCount |
Maximum |
HTTPCode_Backend_2XX |
Sum |
HTTPCode_Backend_3XX |
Sum |
HTTPCode_Backend_4XX |
Sum |
HTTPCode_Backend_5XX |
Sum |
HTTPCode_ELB_4XX |
Sum |
HTTPCode_ELB_5XX |
Sum |
Latency |
Average |
RequestCount |
Sum |
SpilloverCount |
Sum |
SurgeQueueLength |
Maximum |
UnHealthyHostCount |
Maximum |
EstimatedALBActiveConnectionCount |
Average |
EstimatedALBConsumedLCUs |
Average |
EstimatedALBNewConnectionCount |
Average |
EstimatedProcessedBytes |
Average |
This is a default metricset. If the host module is unconfigured, this metricset is enabled by default.
Fields
editFor a description of each field in the metricset, see the exported fields section.
Here is an example document generated by this metricset:
{
    "@timestamp": "2017-10-12T08:05:34.853Z",
    "aws": {
        "cloudwatch": {
            "dimensions": {
                "AvailabilityZone": "us-east-1c"
            },
            "namespace": "AWS/ELB"
        },
        "metrics": {
            "BackendConnectionErrors": {
                "sum": 10
            },
            "HealthyHostCount": {
                "max": 2
            },
            "UnHealthyHostCount": {
                "max": 1
            }
        }
    },
    "cloud": {
        "account": {
            "id": "627959692251",
            "name": "elastic-test"
        },
        "provider": "aws",
        "region": "us-east-1"
    },
    "event": {
        "dataset": "aws.elb",
        "duration": 115000,
        "module": "aws"
    },
    "metricset": {
        "name": "elb",
        "period": 10000
    },
    "service": {
        "type": "aws"
    }
}